Let’s check in on the January NWMLS statistics from around the sound.
We’re going to try something different this month. The usual collection of charts in this post tend to be a big spaghetti mess, so we’re going to keep it simple. If you want to see the usual charts, you can still download the spreadsheet (or in Excel 2003 format). Feel free to share your feedback on the new set of charts in the comments.
Here’s where the YOY stats stand for each of the six counties as of January 2009:
(Note: The “Sales” data below represents pending sales, not closed sales.)
King – Price: -12.1% | Listings: -2.4 | Sales: -5.4% | MOS: 7.8
Snohomish – Price: -14.3% | Listings: -10.1% | Sales: -7.3% | MOS: 8.5
Pierce – Price: -11.8% | Listings: -16.6% | Sales: +30.6% | MOS: 7.2
Kitsap – Price: -15.7% | Listings: -14.3% | Sales: -19.3% | MOS: 7.5
Thurston – Price: -9.8% | Listings: -15.2% | Sales: +5.4% | MOS: 5.3
Island – Price: -21.9% | Listings: -4.7% | Sales: -6.0% | MOS: 12.6
Skagit – Price: -5.4% | Listings: -4.5% | Sales: -25.0% | MOS: 12.0
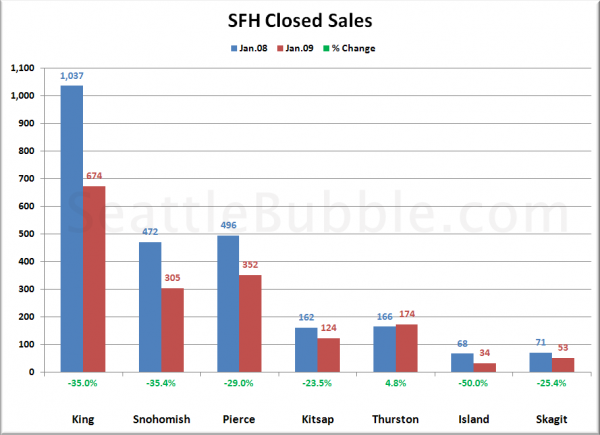
Here is a visual comparison of closed sales in each county in January 2008 and January 2009:
Thurston was the only county in the Puget Sound area to see an increase in actual closed sales from 2008 to 2009. Everywhere else was down by (almost) a quarter or more.
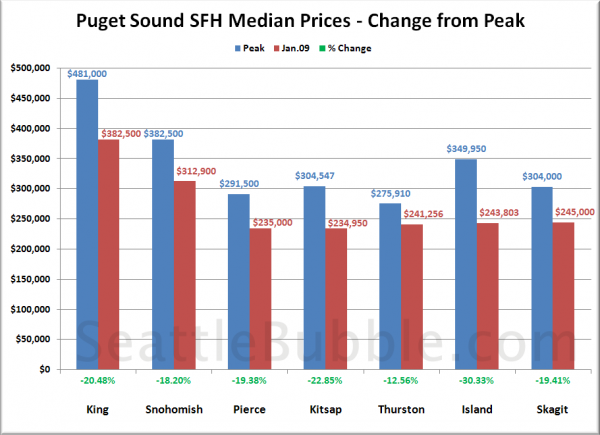
Here’s a comparison of median prices in each county at their respective peaks and in January 2009:
It’s interesting that King County’s January median just happened to be the same as Snohomish County’s March 2007 peak median. It is also worth noting that in addition to actually posting an increase in closed sales, Thurston County has the smallest price drop so far. Overall, the total percentage drops look like a liquidating retail outlet’s going out of business sale: “Everything 10-30% Off!”
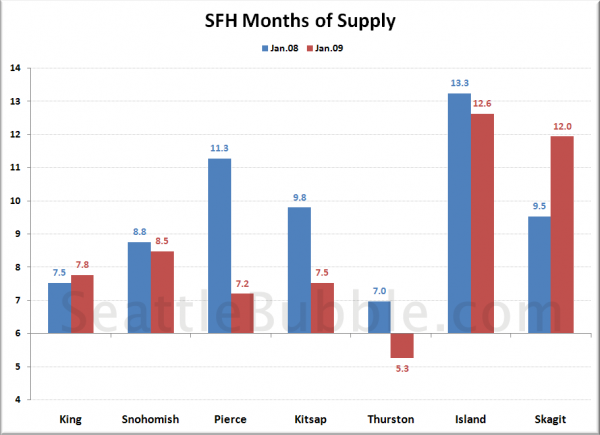
Lastly, here’s a look at “months of supply” across the Sound. Less than six is generally considered a “seller’s market,” while above six is a “buyer’s market.” Months of supply is traditionally calculated using pending sales, so in order to avoid confusion, we are sticking with that method.
King and Skagit were the only counties in which months of supply increased year-over-year. Thurston County sticks out again as the only county where MOS has dropped into “seller’s market” territory. What exactly is going on down there? Perhaps Thurston County was not as popular for debt liars and speculators, so the crash is hitting a little softer down there? Or maybe they have not experienced as many job losses as other counties in the Sound whose major industries are not funded directly by taxpayer dollars? Whatever the case, it’s certainly something worth keeping an eye on.


