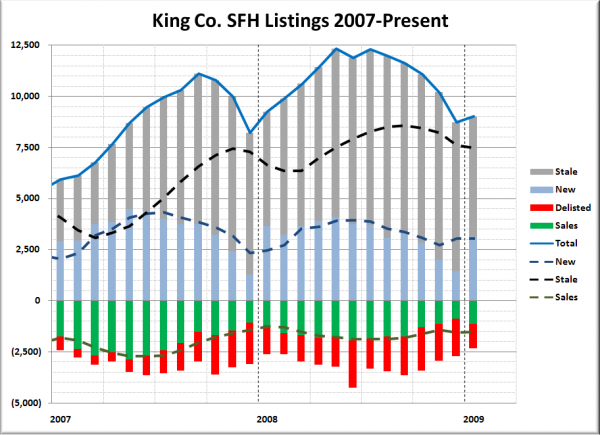
Yesterday’s conversation in the comments touched a little bit on homes that are being delisted (taken off the market without selling), so now seems like a good time to post another update to the listings and sales breakdown chart. Below is the breakdown of homes on the market and homes that went off the market last month in King County (SFH only).
For a full explanation of this chart, check out the post What happens to listings.
January’s 1,159 delistings came in 16% lower than the same month last year, a reversal of the trend that had seen dramatically increasing delistings throughout much of 2008. Last month even came in below the 2000-2006 average for January delistings, which was 1,767.
Delistings typically drop as we head into the spring, and there is no reason not to think that will happen this year as well. The number of homes being delisted is still exceeding the number of pending sales, which is still an indication of a slow market, but in January the difference between the two was only 12 (compared to an average difference of 746 the previous three months).
