Let’s check in on February market statistics from the NWMLS. First up, the NWMLS press release.
Home buyers appear to be in a “mental filibuster,” according to one real estate executive upon seeing the latest figures from Northwest Multiple Listing Service. The report on February activity for 19 counties across Washington shows slight gains in pending sales and selling prices from January, but brokers say many would-be buyers remain on the sidelines, paralyzed by the uncertain economy.
“I believe these results are reflective of what might be called a “mental filibuster” for potential home buyers — they are struggling between the desire to buy a home and the uncertainty of what might come next in the way of government stimulus, tax credits or lower mortgage rates,” observed Ron Sparks, managing vice president of Coldwell Banker Bain. Agents are reporting “tremendous activity” at open houses, with the last few weekends generating the best activity in several months. Despite the high interest, what’s stopping buyers, according to Sparks, is weak consumer confidence.
“Buyers don’t yet understand what the stimulus package means to them,” said NWMLS director Kathy Estey, managing broker of John L. Scott’s Bellevue Downtown office. “Good houses at good prices that are affordable are getting attention,” she remarked, noting her office had four multiple offer situations the last week of February for homes priced under the median cost. “Open house activity is up and attendees are serious,” Estey reported.
Sweet. With all the actual measurable statistics in the gutter, it’s back to the old nebulous standby of “open house activity.”
Here’s your King County SFH summary:
February 2009
Active Listings: down 4% YOY
Pending Sales: down 21% YOY
Closed Sales: down 42% YOY
Months of Supply: 7.5
Median Closed Price*: $375,000 – down 12.8% YOY
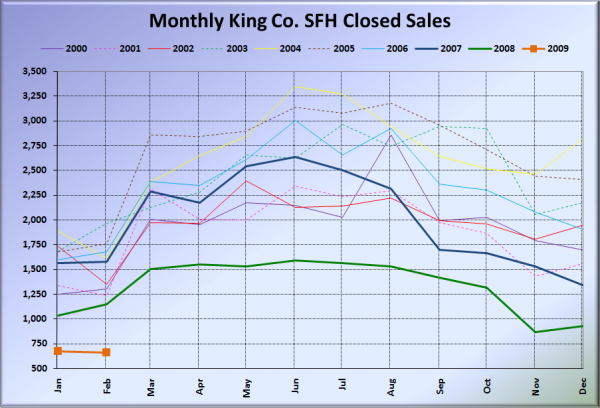
Closed sales remained in the gutter, dropping to yet another new low of just 661 in February, despite a 27% increase in last month’s pending sales. January closed out with 1,159 pending sales, but only 661 closed in February—57%. Interesting. Meanwhile, inventory continued to grow on a trend similar to (but slightly lower than) last year.
Here is the updated Seattle Bubble Spreadsheet, and here’s a copy in Excel 2003 format. Click below for the graphs and the rest of the post.
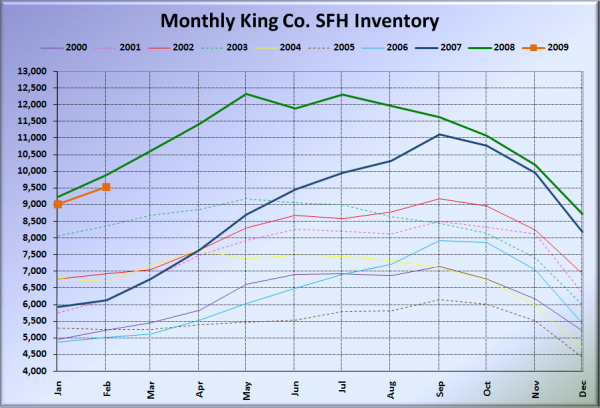
Here’s the graph of inventory with each year overlaid on the same chart.
Inventory continued to track fairly close to 2008, but remained slightly under the record highs set last year.
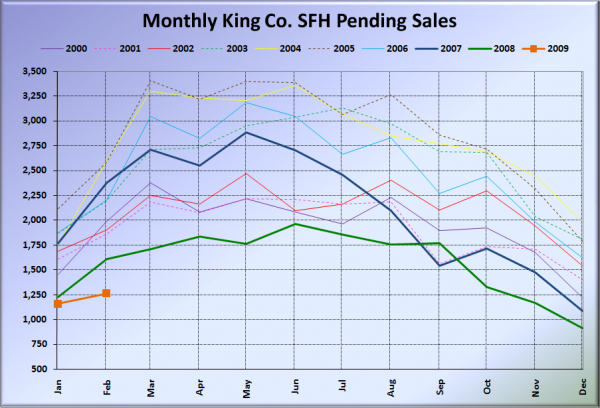
Pending sales were dramatically lower than last year, setting an all-time low for February, and posting one the weakest January-to-February increase in at least the last ten years.
Closed sales would have to more than double next month just to get back to the weak level of 2008 volume. Ouch.
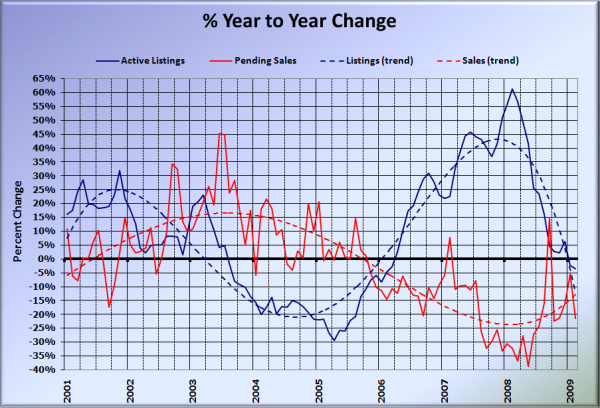
Here’s the supply/demand YOY graph.
Sales dropped back into -20% territory, as listings continued to move just barely negative.
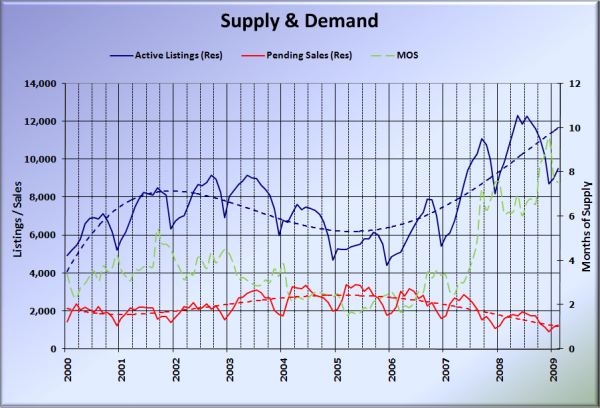
Here’s the chart of supply and demand raw numbers:
This chart makes the still-record-high level of inventory more obvious. The number of listings on the market at the end of February 2009 was higher than the highest points set in the summer and fall of 2000-2007.
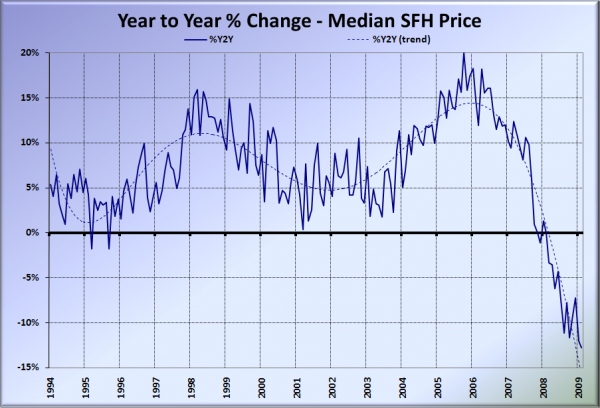
Here’s the median home price YOY change graph:
Yet another new low at 12.8% down from February 2008.
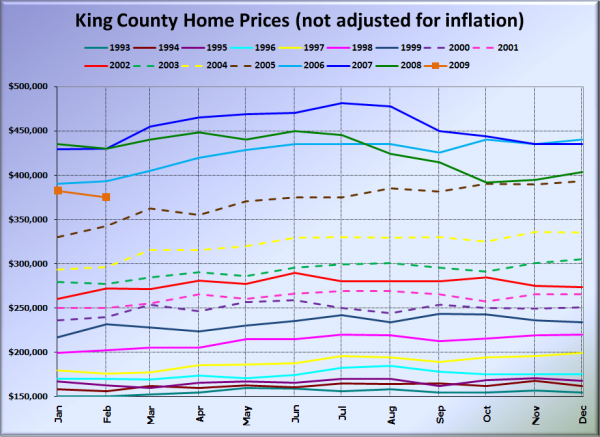
And lastly, here is the chart comparing King County SFH prices each month for every year back to 1994.
February 2009 King County median SFH price: $375,000.
June 2005 King County median SFH price: $375,000.
If only I had bought a house instead of starting this blog in August 2005, I could have enjoyed -3% appreciation!
Here are the news blurbs from the Times and P-I. Check back tomorrow for the full reporting roundup.
Seattle Times: Home sale prices continue to decline in February in Puget Sound area
Seattle P-I: Local real estate: few sales, falling prices
