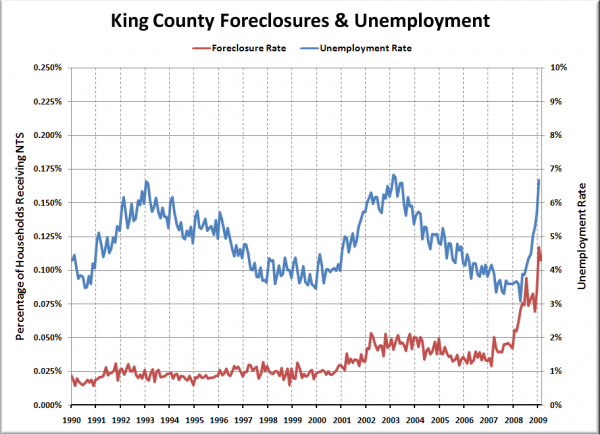
By request, here is a chart showing Notices of Trustee Sale and Unemployment. Note that the scale for each data set is different to allow their rates of change to be more easily compared.
The chart above shows the monthly percentage of households receiving a Notice of Trustee Sale (on the left axis) and the unemployment rate as reported by the Washington State Employment Security Department (on the right axis). Monthly unemployment data for King County is only available back through 1990.
As of January (the most recent data available), King County’s unemployment rate is sitting right at the value it hit at its peak in the early 1990s recession and the dot-com bust—6.7% However, the foreclosure rate is double the maximum point that it reached in 2002.
Both the foreclosure rate and the unemployment rate are currently rising far more rapidly than we have seen at any point in the last two decades.
From July 1990 to January 1993, the unemployment rate rose 3.1 percentage points, or about 0.1 points per month. From December 1999 to February 2003, the unemployment rate rose 3.3 points, or about 0.09 points per month. Since April of last year, King County’s unemployment rate has risen 3.6 points, or about 0.4 points per month. That’s four times faster than it rose during the last two recessions.
Likewise, the foreclosure rate rose 0.0015 points per month in the early ’90s and 0.0012 points per month from ’99 to ’02, but has risen 0.0038 points per month since early ’07, climbing two and a half to three times faster than the previous two recessions.
It is interesting to note that the foreclosure rate began its rapid ascent slightly before the unemployment rate began to shoot up. While I’m certain the unprecedented rate at which unemployment is climbing is a contributing factor in the increased foreclosures, I do not think the data supports the conclusion that it is the primary cause.
