Let’s check in on the February NWMLS statistics from around the sound. I apologize for the tardiness of this month’s Puget Sound roundup. I’ve got something really cool in the works for this data coming up, and I mistakenly thought it would be coming this month. Next month though, watch this space for something I think you’re really going to enjoy.
I’m going to stick this month with the simple collection of charts, since nobody complained about the lack of the spaghetti mess last month. If you want to see the usual charts, you can still download the spreadsheet (or in Excel 2003 format).
Here’s where the YOY stats stand for each of the six counties as of February 2009:
(Note: The “Sales” data below represents pending sales, not closed sales.)
King – Price: -12.8% | Listings: -3.5% | Sales: -21.4% | MOS: 7.5
Snohomish – Price: -12.1% | Listings: -13.2% | Sales: -22.1% | MOS: 8.2
Pierce – Price: -7.8% | Listings: -18.6% | Sales: +1.2% | MOS: 6.9
Kitsap – Price: -9.8% | Listings: -19.1% | Sales: +11.8% | MOS: 7.0
Thurston – Price: -0.2% | Listings: -18.9% | Sales: -12.3% | MOS: 5.5
Island – Price: -22.8% | Listings: -10.4% | Sales: -6.8% | MOS: 12.9
Skagit – Price: -5.4% | Listings: -6.8% | Sales: -33.1% | MOS: 11.7
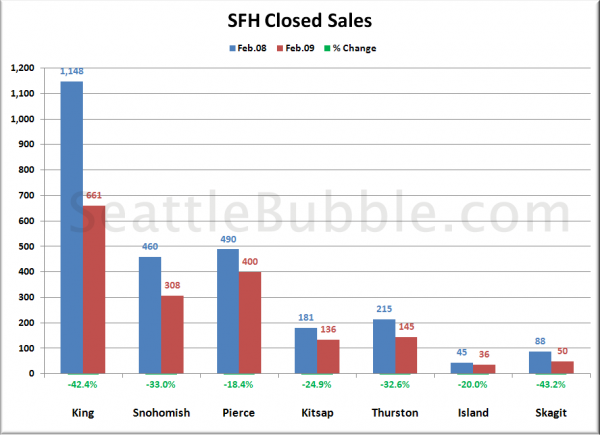
Here is a visual comparison of closed sales in each county in February 2008 and February 2009:
Actual closed sales declined across the board in the seven counties in February, by as little as 20% in Island and as much as 42% in King (ouch).
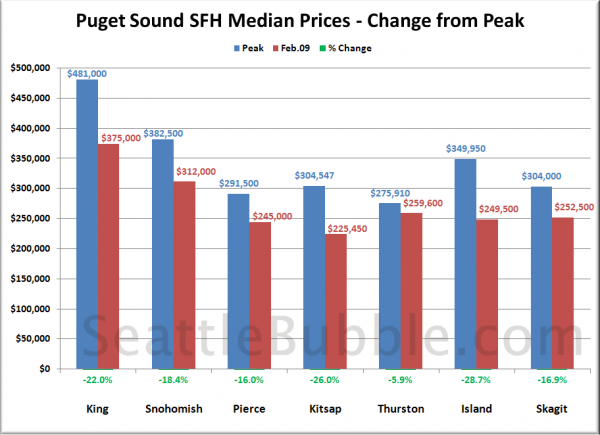
Here’s a comparison of median prices in each county at their respective peaks and in February 2009:
King County is now cheaper than Snohomish County was at the peak, while Snohomish County is rapidly approaching Pierce County’s peak. The smallest overall decline is still in Thurston County, where prices are a mere 6% off their peak values.
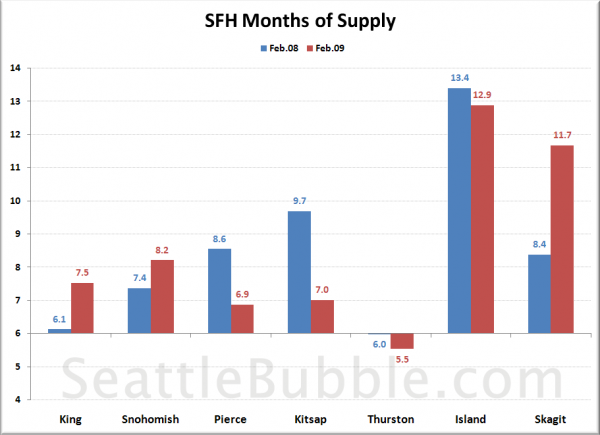
Lastly, here’s a look at “months of supply” across the Sound. Less than six is generally considered a “seller’s market,” while above six is a “buyer’s market.” Months of supply is traditionally calculated using pending sales, so in order to avoid confusion, we are sticking with that method.
The largest year-over-year MOS increases came in King County and Skagit County, while Pierce, Kitsap, and Island all declined year-over-year. Thurston continues to show resilience in the Months of Supply department as well. It would seem that month after month we are seeing the stats down in Thurston County stick out as the least weak of the bunch. This definitely merits some further study, to see why the unwinding is so much less intense down in Olympia.


