Let’s check in on March market statistics from the NWMLS. When it’s posted the NWMLS press release will be here, along with links to this month’s overview pdfs.
Update: The press release has been posted: Brokers report signs of improvement in “real-time” housing market
Pending sales around Western Washington for the month of March reached the highest level in six months, according to the latest figures from Northwest Multiple Listing Service.
Compared to February, last month’s pending sales (offers made and accepted, but not yet closed) surged 25 percent, rising from 4,559 transactions to 5,701. Last month’s volume was down 5.6 percent when compared to twelve months ago, but it was the highest monthly total since September when brokers reported 5,982 pending sales.
You know there still isn’t much actual good news out there when they continue to resort to month-over-month comparisons.
Here’s your King County SFH summary:
March 2009
Active Listings: down 9% YOY
Pending Sales: down 2% YOY
Closed Sales: down 36% YOY
Months of Supply: 5.7
Median Closed Price*: $363,850 – down 17.3% YOY
Sales jumped up in March, as they do every year in the spring. Prices continue to drop like a rock, and meanwhile, county-wide months of supply dropped back below 6.0 for the first time in a year and a half.
Here is the updated Seattle Bubble Spreadsheet, and here’s a copy in Excel 2003 format. Click below for the graphs and the rest of the post.
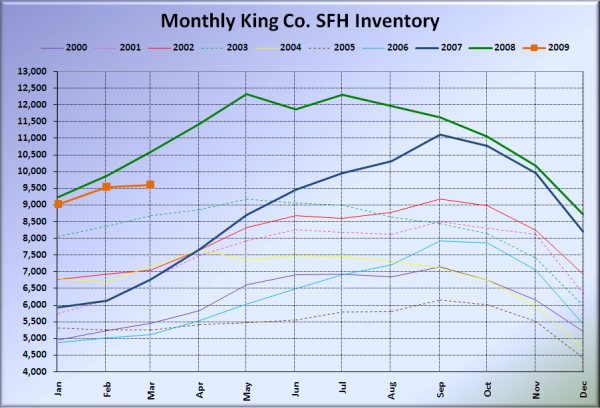
Here’s the graph of inventory with each year overlaid on the same chart.
Inventory growth flattened out in March compared to last year, a trend that most observers have seen coming for some time. Here’s the pattern we have seen in other markets once home prices begin dropping in earnest: 1) Inventory drops. 2) Sales pick up. 3) Prices keep falling.
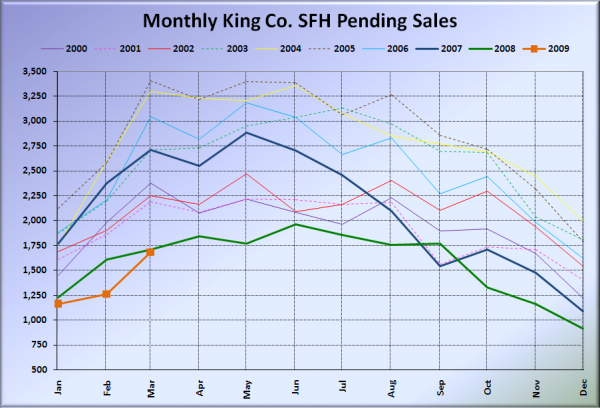
Pending sales took a sharper increase in March than they did last year, rising almost to the 2008 level.
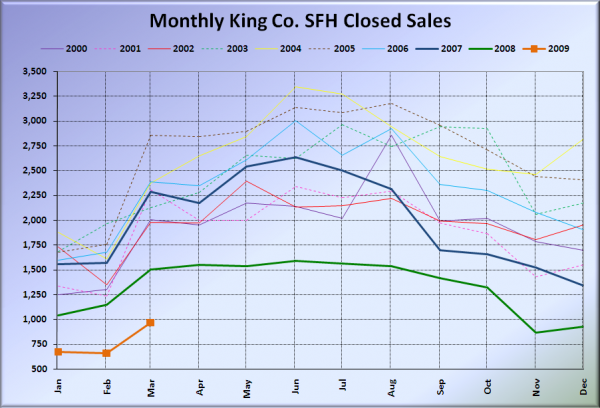
Closed sales stayed about the same compared to last year. It will be interesting to see if March’s big spike in pendings translates into a jump in April closings, which are usually relatively flat compared to March.
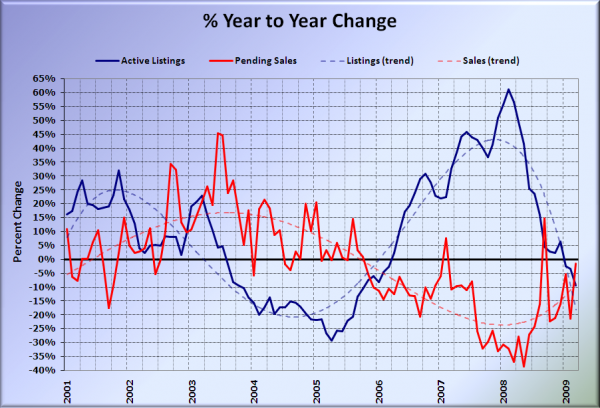
Here’s the supply/demand YOY graph.
Both curves following the trends they have been setting over the last few months. Nothing too surprising.
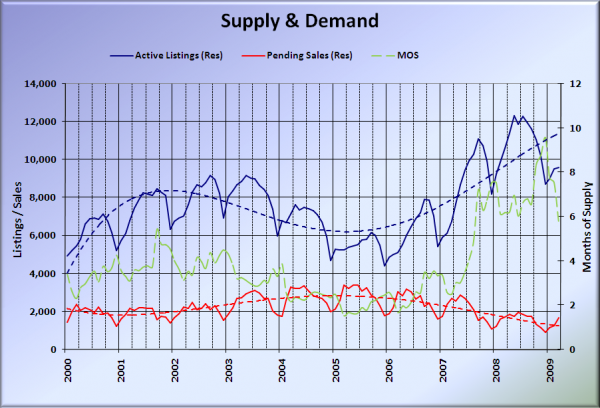
Here’s the chart of supply and demand raw numbers:
March’s flat inventory sticks out as somewhat unusual on this chart. If prices keep dropping, I suspect this will be a fairly flat year overall for inventory as more buyers are able to get into the market at reasonable price points.
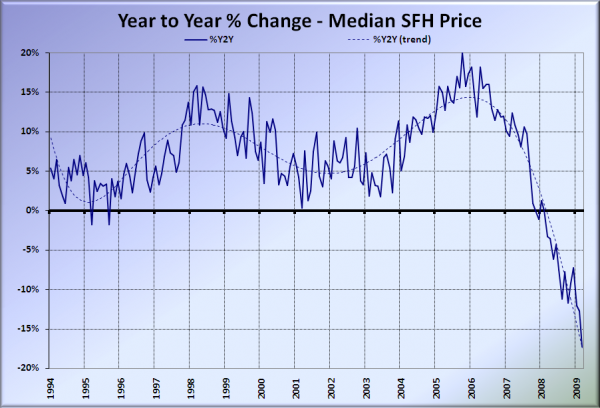
Here’s the median home price YOY change graph:
Whoops, had to adjust the vertical scale on this one. March’s 17.3% drop blasted the previous low out of the water, so to speak.
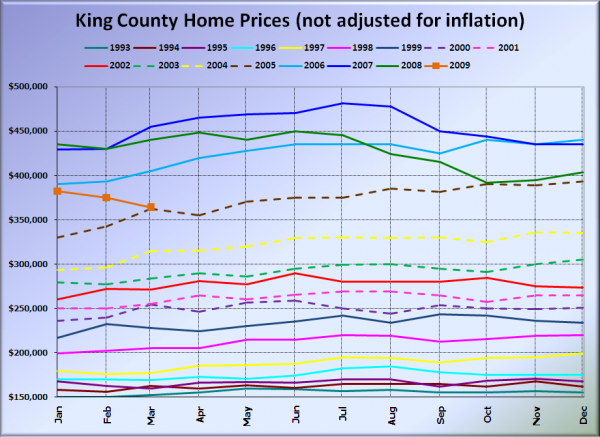
And lastly, here is the chart comparing King County SFH prices each month for every year back to 1994.
March 2009 King County median SFH price: $363,850.
March 2005 King County median SFH price: $362,000.
$30,000 more off the median and we’ll be bumping into 2004 pricing.
I’ll update this post with news blurbs from the Times and P-I when they become available. As usual, check back tomorrow for the full reporting roundup.
Seattle Times: March home sales, prices continue to decline compared with a year ago in King County
