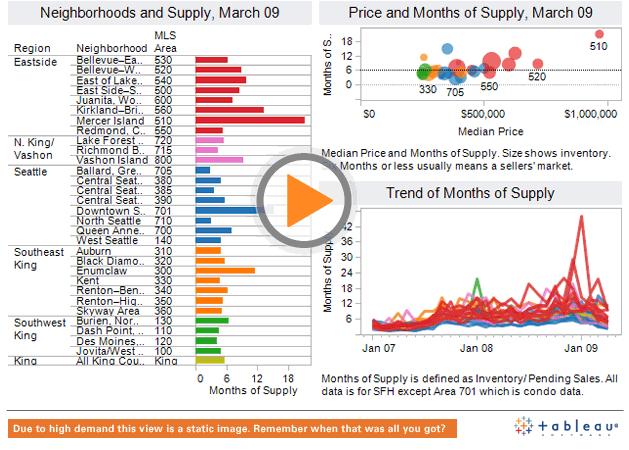
Here’s your look at March’s “Months of Supply” for the 30 NWMLS areas in King County. For an explanation of what months of supply means, please refer to the original neighborhood MOS breakdown post. Also, view a map of these areas here. In place of our usual boring static charts, this month we are proud to expand our usage of interactive data visualizations from Tableau Software into a new monthly update.
Unfortunately, due to a change in definition by the NWMLS last July, the number of active listings will be lower than a year ago, while the number of pending sales will be higher, causing the months of supply to be lower than it would otherwise have been.
Summary
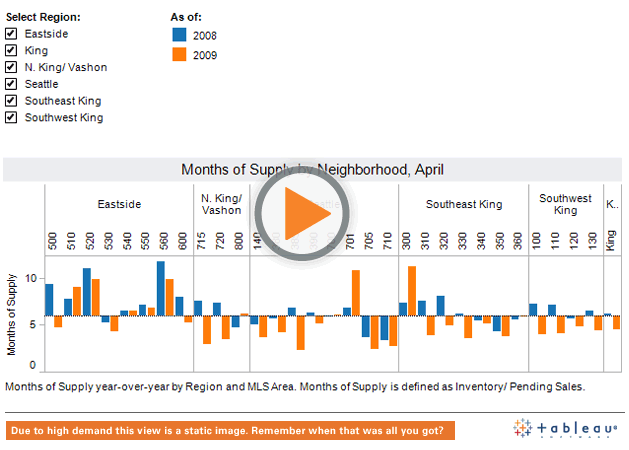
April MOS for King County as a whole dipped down further into so-called “seller’s market” territory at 4.5.
Here’s a year-over-year comparison for each NWMLS neighborhood. Again, take the below comparison with a giant grain of salt, since the NWMLS has changed the way they count listings and pendings since last year. As an example of how this data may be skewed, if there were 6,000 active listings last year (300 of which—5%—were “subject to inspection”) and 1,000 pending sales, we would have had 6.0 months of supply. However, this year under the new counting method, the same scenario would result in 5,700 active listings and 1,300 pending sales (300 being “pending inspection”), giving us 4.4 months of supply—27% lower.
Year-Over-Year Comparison
Even with the change, most of the Eastside remains above 6 months of supply, while most of the other neighborhoods around King have dropped below 6.
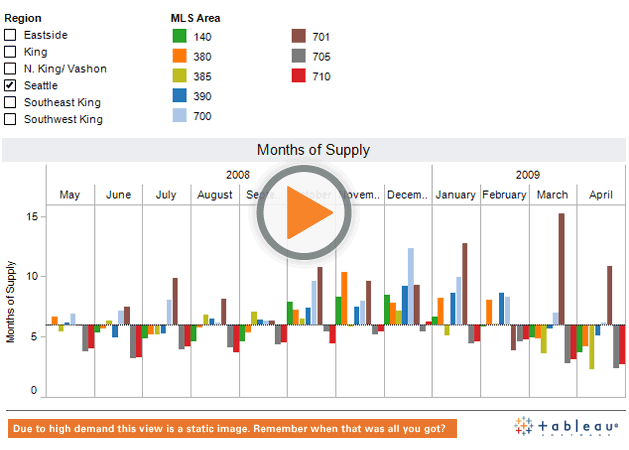
Regional History
Months of supply decreased again in most neighborhoods from March to April, matching the normal seasonal pattern. Just nine of thirty neighborhoods remained in “buyer’s market” territory.
The cumulative MOS for Seattle proper dropped further into “seller’s market” territory at 3.7, while the Eastside as a whole dropped as well, but remained a “buyer’s market” at 6.2.
The three toughest markets for sellers were Enumclaw (300) at 11.3, Downtown Seattle condos (701) at 10.8, and Kirkland–Bridle Trails (560) at 9.9.
The three best markets for sellers as of last month were Central Seattle SW / Beacon Hill (385) at 2.3, Ballard/Greenlake/Greenwood (705) at 2.4, and North Seattle (710) at 2.7.