Let’s take a look at May market statistics from the NWMLS. I’ll update this post with a link to their press release when they post it. [Update] Here it is: Inventory shrinking, sales rising, prices stabilizing in some Northwest MLS areas
Here’s your King County SFH summary, with helpful arrows to show whether the direction of each indicator is positive or negative news for buyers and sellers:
| May 2009 | Number | MOM | YOY | Buyers | Sellers |
| Active Listings | 9,852 | +2.5% | – | – | – |
| Closed Sales | 1,312 | +30.7% | -14.4% |  |
 |
| SAAS (?) | 2.33 | -18.7% | -7.3% |  |
 |
| Pending Sales | 2,246 | +6.2% | – | – | – |
| Months of Supply | 4.39 | -3.5% | – | – | – |
| Median Price* | $375,000 | -1.3% | -14.8% |  |
 |
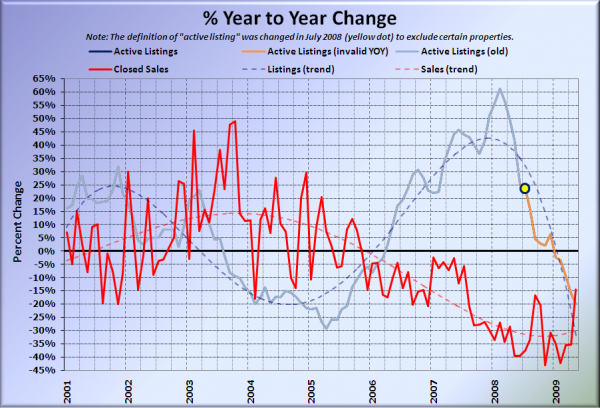
Note that due to the change in definitions, year-over-year comparisons of pending sales, active listings, and months of supply will not be valid until July.
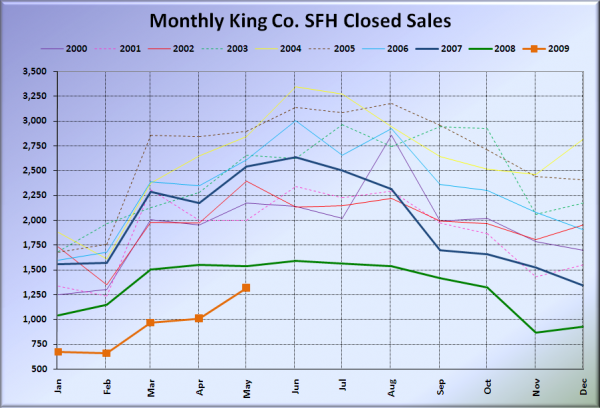
Closed sales posted a relatively strong month-to-month increase, but still came in negative year-over-year.
Back in January I predicted that sales would “eventually flatten out and maybe even show YOY gains” in 2009. Given that June has been the high point for sales in five of the last nine years (with only 3 years peaking later in the year), it looks like this month will have to be exceptionally strong for my prediction to have any chance of being correct.
Here is the updated Seattle Bubble Spreadsheet, and here’s a copy in Excel 2003 format. Click below for the graphs and the rest of the post.
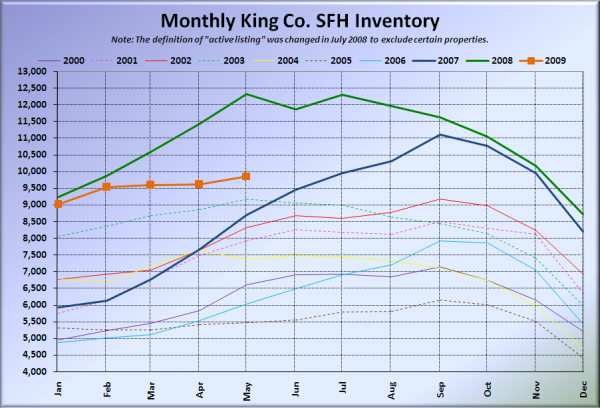
Here’s the graph of inventory with each year overlaid on the same chart.
Note that unfortunately, the current data is not really comparable with pre-July 2008 data.
Here’s the supply/demand YOY graph. In place of the now-unreliable measure of pending sales, the “demand” in the following two charts is now represented by closed sales, which have had a consistent definition throughout the decade.
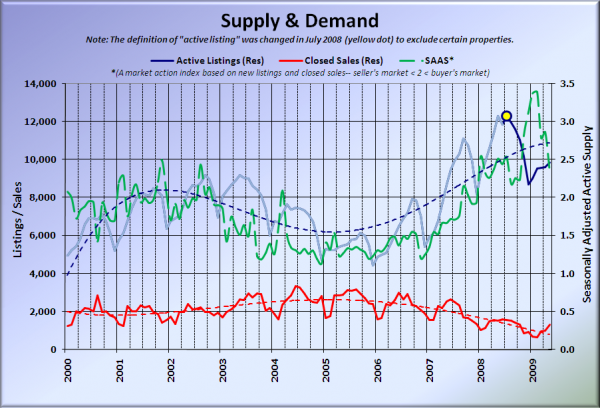
Here’s the chart of supply and demand raw numbers:
June will be the moment of truth for 2009. Will sales flatten out, or spike up to positive YOY territory?
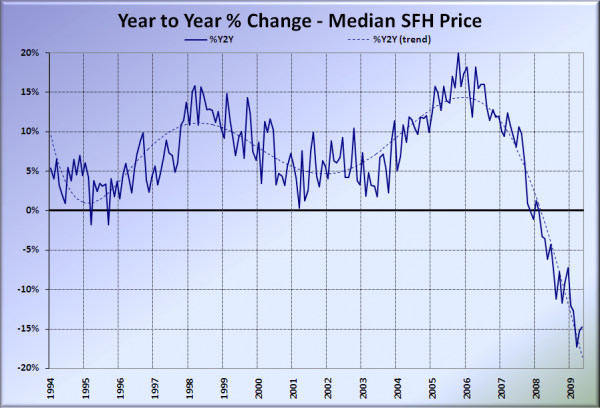
Here’s the median home price YOY change graph:
Still hovering in the -15% YOY range.
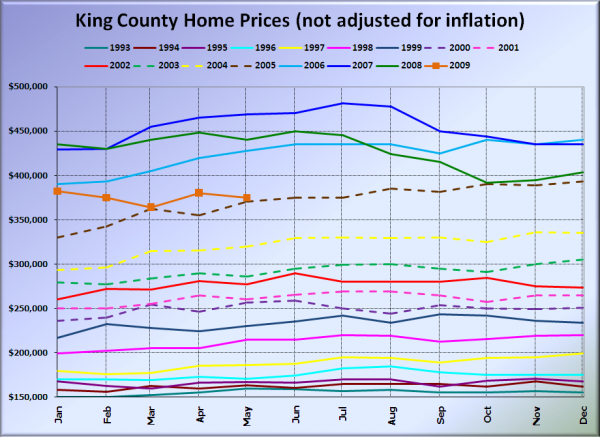
And lastly, here is the chart comparing King County SFH prices each month for every year back to 1994.
May 2009 King County median SFH price: $375,000.
June 2005 King County median SFH price: $375,000.
I’ll update this post with news blurbs from the Times and P-I when they become available. As usual, check back tomorrow for the full reporting roundup.
[Update]
Seattle P-I: Pending home sales up again, but will they close?
Seattle Times: King County median home prices in May continue to decline from year ago
