Due to the definition change by the NWMLS in both the numerator and the denominator in the “months of supply” calculations, I am changing the regular monthly neighborhood update to Seasonally-Adjusted Active Supply (SAAS). For an explanation of what seasonally-adjusted active supply is, please refer to this post. Also, you may view a map of the areas discussed in this post.
Yet again, the sweet interactive data visualizations in today’s post come to you courtesy Tableau Software.
In the charts below I have taken the calculated value for SAAS and subtracted 2, in order to better visualize the difference between a buyer’s market and a seller’s market. Using this method, negative SAAS values indicate a seller’s market, while positive values indicate a buyer’s market.
Summary
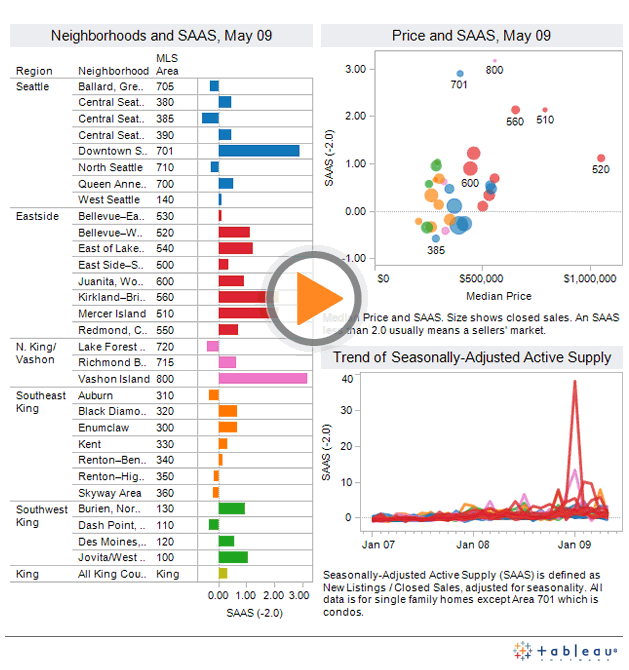
King County’s overall SAAS dipped slightly in May, from April’s 2.9, but remained slightly in “buyer’s market” territory at 2.3.
Hit the jump for the rest of this month’s interactive charts and commentary.
Here’s a year-over-year comparison for each NWMLS neighborhood.
Year-Over-Year Comparison
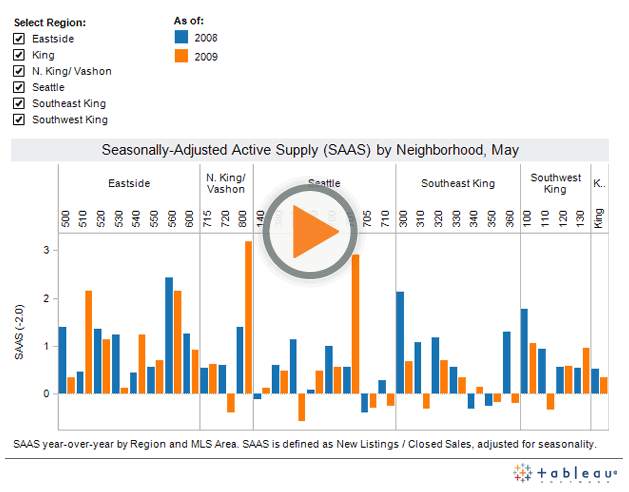
Only eight of thirty neighborhoods were in “seller’s market” territory in May, none of which were located on the Eastside.
Regional History
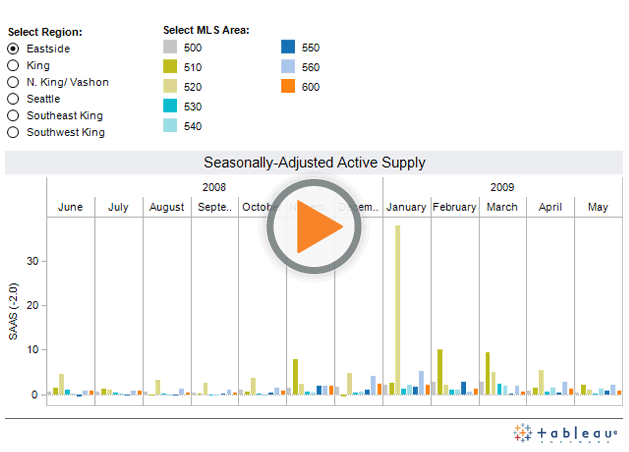
Seasonally-adjusted active supply decreased in most neighborhoods from April to May, as one would expect due to the seasonal nature of the real estate market. Jovita / West Hill Auburn (100) and Des Moines / Redondo (120) were notable exceptions.
The three toughest markets for sellers were Vashon Island (800) at 5.2, Downtown Seattle condos (701) at 4.9, and Kirkland–Bridle Trails (560) and Mercer Island (510) tied at 4.1.
The three best markets for sellers as of last month were Central Seattle SW / Beacon Hill (385) at 1.4, Lake Forest Park / Kenmore (720) at 1.6, and Dash Point / Federal Way (110) at 1.7.