Back in February while the market’s deep freeze was leading some observers to anxiously declare that we had reached the bottom, here at Seattle Bubble we sliced and diced the market in Bottom-Calling Week. In the series we explored six different analytical methods for predicting when real estate around Seattle would hit “the bottom.”
Six new months of Case-Shiller data have been released since that series and two potential bottom dates are now in the rear-view mirror. It seems like good time for a little checkup.
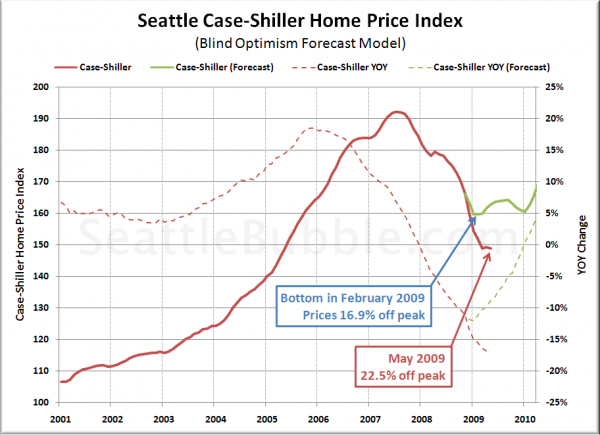
First up, Method 0: Blind Optimism. Our “Blind Optimism” forecast method was based on a mere gut feeling that January was the peak for year-over-year drops. This method predicted a bottom in February at 16.9% off the peak. Let’s see how that turned out:
I guess we can put that one to bed. February was definitely not the bottom.
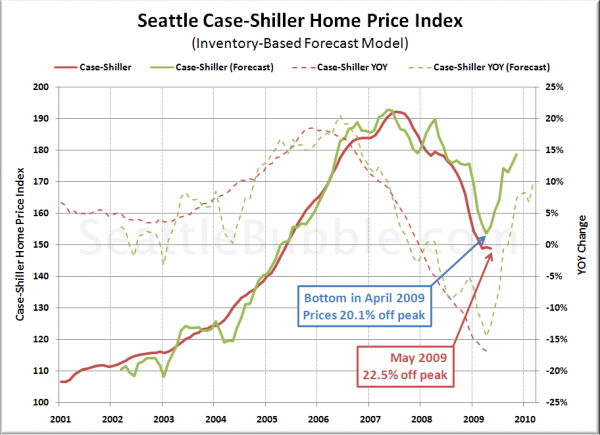
Next, let’s check in on Bottom-Calling: Inventory-Based Forecast, which was based on the relationship between standing inventory (“active listings”) and home prices that Deejayoh explored in his post Why Inventory Matters, and predicted a bottom in April at 20.1% off the peak.
Looks like April wasn’t the bottom either. Although, in fairness, in the time since we made this forecast, we discovered that the NWMLS changed the definition of “active listing” back in July 2008 a way that resulted in lower inventory being reported at the end of the month. So it’s no real surprise that this method turned out not to be very reliable.
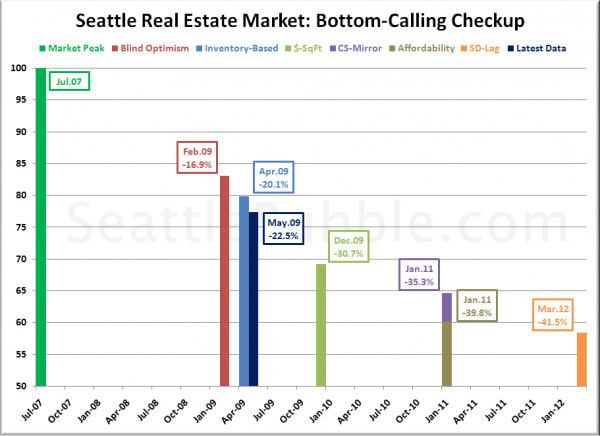
Lastly, let’s check in on a summary of where we’re at so far with respect to all six of our bottom-calling methods:
Our official February 2009 call was for 36% off the peak in December 2010. Six months later, I’m still comfortable sticking with that guess.


