Let’s check in on an update of how the sales volume is breaking down among the different price tier regions around the county. For a more in-depth explanation of the process and reasoning behind this data, hit this post.
As of July, this is where the median prices were for our regions:
- low end (South Co.): $227,500—$324,712
- mid range (Seattle / North Co.): $282,750—$566,000
- high end (Eastside): $392,500—$1,060,500
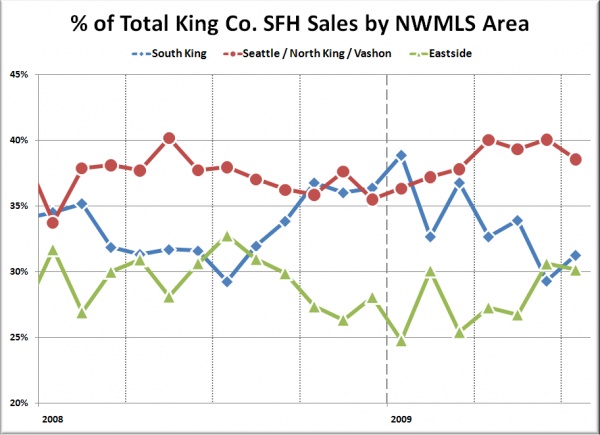
The following chart shows the percentage of each month’s closed sales that took place in each of the three regions.
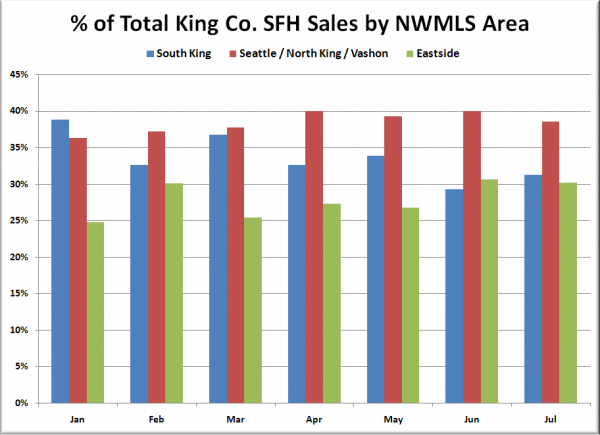
Here’s how much of the total sales each of our three regions accounted for in July:
- low end (South Co.): 31.3% of sales
- mid range (Seattle / North Co.): 38.6% of sales
- high end (Eastside): 30.2% of sales
The mid-priced region (Seattle) continued to take up a larger-than-usual portion of the sales in July, with the low and high-priced regions see-sawing again, but to a lesser degree than the dramatic spike seen from May to June.
Here’s a close-up of this year’s movement in bar-chart format:
I suspect that as we continue to see prices fall, there will be a continuing pattern of more sales in the close-in Seattle neighborhoods. When homes became too ridiculously expensive during the bubble, many people employed the “drive ’til you qualify” tactic when purchasing. Now that prices are coming back down to earth, it would appear that the strategy has shifted to “wait until the neighborhood you want to buy in falls into your price range.”

