Let’s check in on an update of how the sales volume is breaking down among the different price tier regions around the county. For a more in-depth explanation of the process and reasoning behind this data, hit this post.
As of August, this is where the median prices were for our regions:
- low end (South Co.): $144,000—$343,250
- mid range (Seattle / North Co.): $302,000—$573,000
- high end (Eastside): $400,000—$915,000
It is interesting to note that no NWMLS area had a median above $1,000,000 in August.
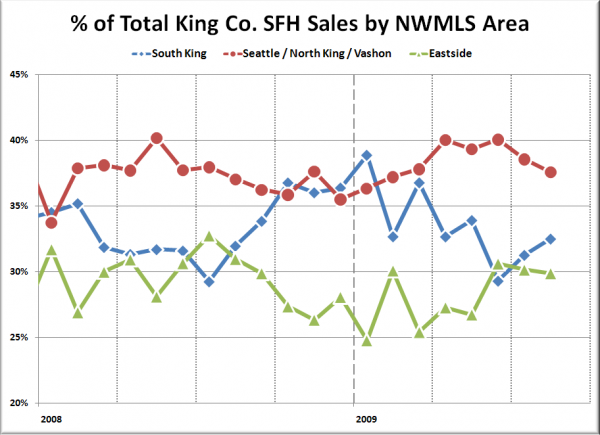
The following chart shows the percentage of each month’s closed sales that took place in each of the three regions.
Here’s how much of the total sales each of our three regions accounted for in July:
- low end (South Co.): 32.5% of sales
- mid range (Seattle / North Co.): 37.6% of sales
- high end (Eastside): 29.9% of sales
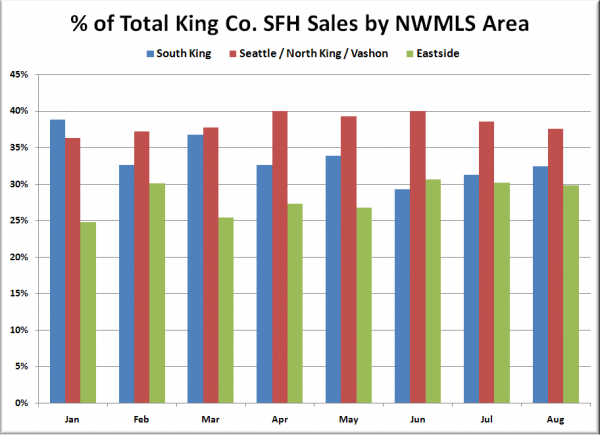
The low-priced region (South King Co.) has been creeping back up the last couple of months. This could be due to the $8,000 tax credit that will expire at the end of November, which is likely much more of an incentive for low-end buyers than for middle or high-end buyers, who are usually not first-time home buyers.
Here’s a close-up of this year’s movement in bar-chart format:
It will be interesting to see how long the low-end region gains ground. I suspect that we may see a bit of a spike in November as people move to take advantage of the tax credit at the last minute, but as we move toward the end of the year and into 2010, we will begin to see the low-end sales taper off again, leading to another upward tick in the median price. Meanwhile, I suspect that Case-Shiller may remain mostly flat through the summer, based on the geographic shifts in sales and the reported county-wide median.

