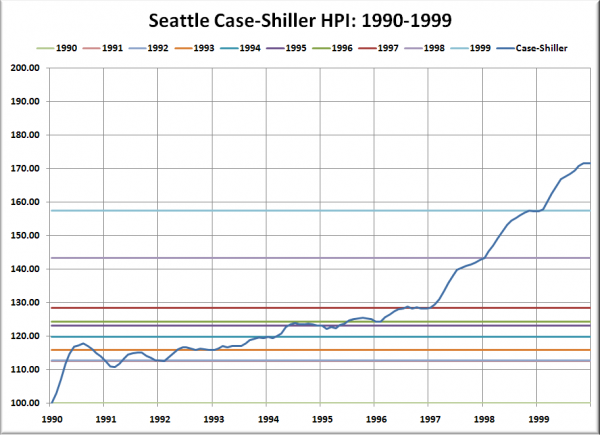
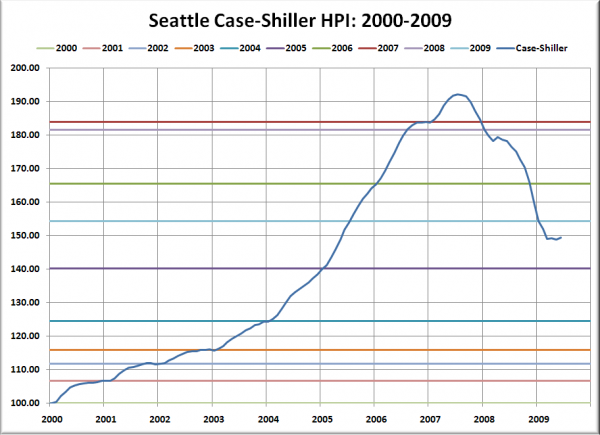
Just for kicks: Seattle’s Case-Shiller Home Price Index in the ’90s and the ’00s (through June). Each series is indexed to 100 at the start of the decade. Colored horizontal lines represent the value of the index at the start of each year.
| change | 1990-1999 | 2000-2009 (June) |
| Total | +71.63% | +49.53% |
| 1st Half | +23.18% | +38.61% |
| 2nd Half | +39.35% | +6.67% |
| Avg. Yearly | +5.55% | +4.33% |
| Max 1-Year | +12.54% | +18.46% |
| Min 1-Year | -2.29% | -16.81% |
| Months ≥ +10% YOY | 15 | 33 |
| Months ≤ -5% YOY | 0 | 14 |

