Here’s a quarterly check on the jobs situation around Seattle, courtesy of data from the Washington State Employment Security Department. The style of these charts are stolen from the excellent San Diego housing reporter Rich Toscano.
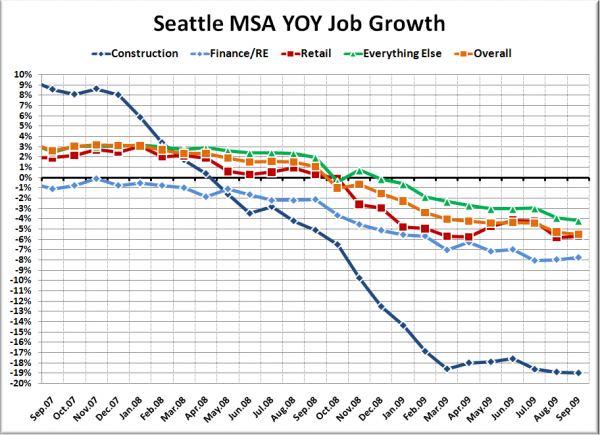
First up, here’s a two-year chart (stolen from my subscription journal Sound Housing Quarterly) of the year-over-year change in some of the broad job categories related to housing:
As of September, construction was still bleeding jobs at a rate of nearly 20% per year, though the rate of change has at least leveled off since March. Finance and real estate jobs have shown a similar pattern, leveling off at around 7-8% year-over-year drops. No particular signs of improvement in the year-over-year numbers just yet though.
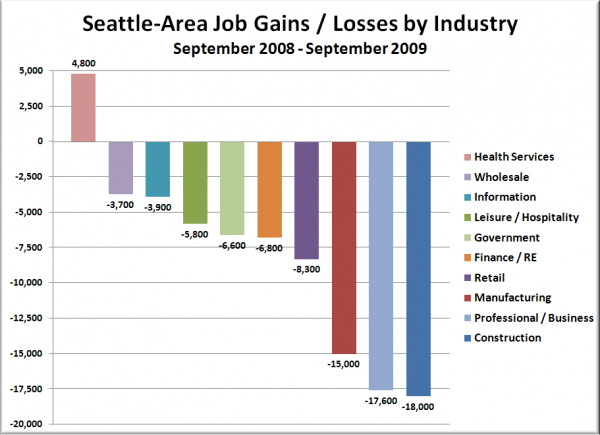
The following chart shows the volume of job gains or losses in the last 12 months in some of the largest Seattle-area industries:
The same three sectors that were hurting in our June update are still suffering as of September: manufacturing, construction, and professional / business services. Between the three, a total of 50,600 jobs have been lost in the last year. Health care was the only major sector that added jobs in the period.
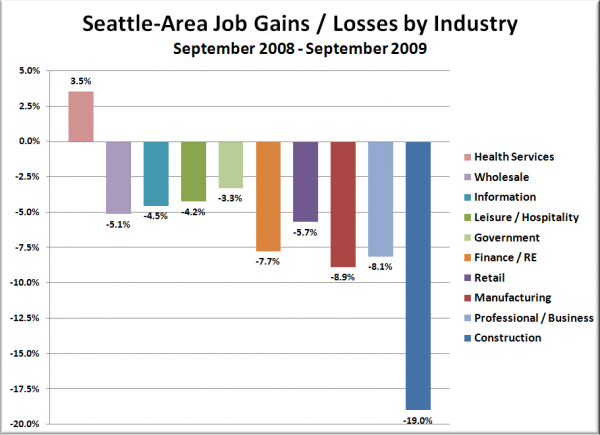
Here’s a look at the same data, broken down by the year-over-year percentage change, to give a better picture of the relative health of various industries:
Construction sticks out like a sore thumb in this view, with finance / real estate joining the general range of losses seen in manufacturing and professional / business services.
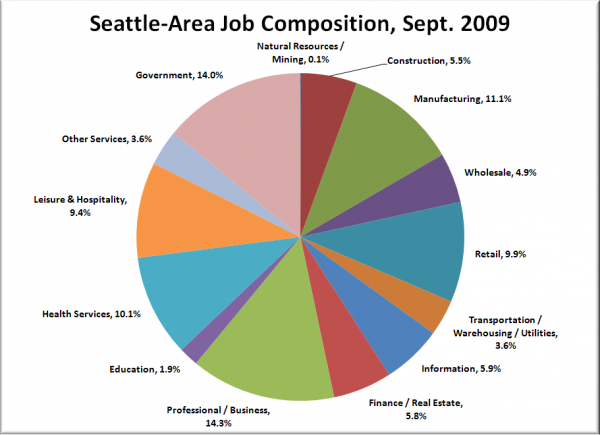
Lastly, here’s a big pie chart showing all major industries that make up Seattle’s job market, to give you some additional perspective to the above data:


