Skip to content

Seattle Bubble

local real estate news, statistics, and commentary without the sales spin.

Menu
  • Home
  • About
  • Contact
  • Reference
  • Speaking
Menu

Quick Look: November 2009 in Bar Charts

Posted on December 8, 2009December 7, 2009 by The Tim

Time for an installment of “quick look,” a series of posts in which I present a fresh set of charts for some recent data with minimal commentary.

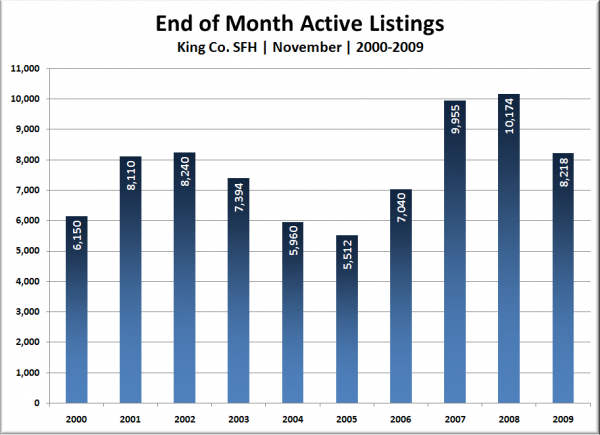
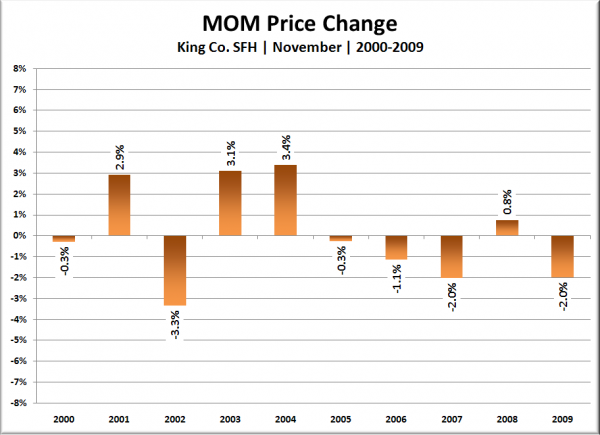
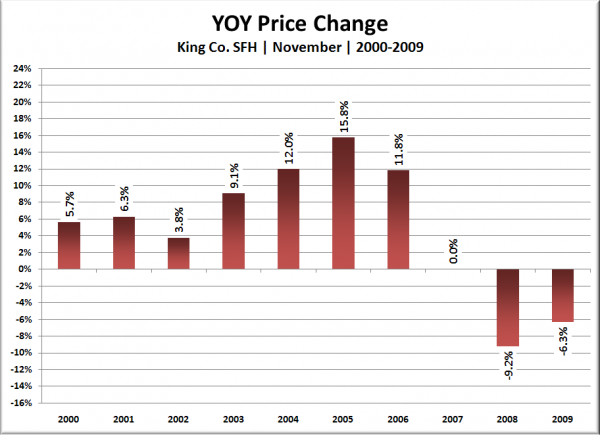
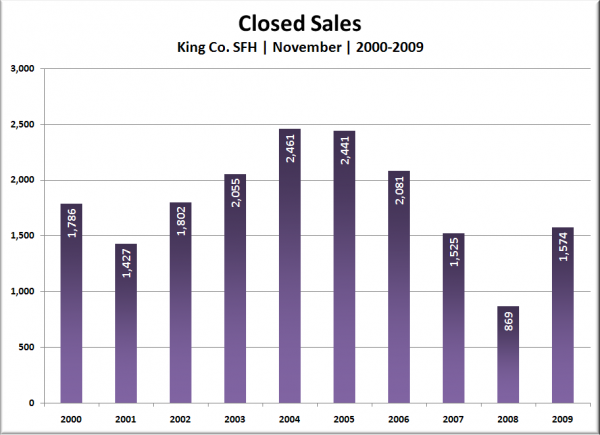
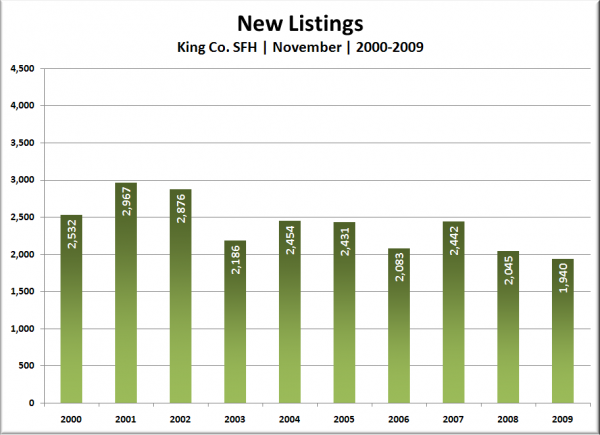
Today’s theme is King County SFH November stats in bar charts compared to each November since 2000.

King Co. SFH Closed Sales: October

King Co. SFH New Listings: October

King Co. SFH End of Month Active Listings: October

Note that the definition of “Active Listings” was revised in July 2008 to exclude certain listings.
King Co. SFH MOM Price Change: October

King Co. SFH YOY Price Change: October

Share:

  • Twitter
  • LinkedIn
  • Facebook
  • Reddit
  • Pinterest
  • Email

Continue Reading

Next Post:
Poll: Guess the lowest 1-month total closed SFH sales in King Co. for winter ’09-’10
Previous Post:
Personal Incomes Up Slightly, Homes Still Overpriced

Tim’s Other Projects

Dispatches from the Multiverse

Tip Jar

Like what we're doing?

Drop us a tip!

Accounts

  • Log in
  • Entries feed
  • Comments feed
  • WordPress.org
©2025 Seattle Bubble | Built using WordPress and Responsive Blogily theme by Superb