As many of you probably know, Redfin has a great feature that allows you do download the results of any search to an Excel file. One aspect of this feature that you may not be aware of is that one of the fields that is populated on the resulting spreadsheet indicates whether or not each listing is a short sale.
Just for kicks, I downloaded the data from Redfin for all closed sales records for single-family homes in King County within the last month. According to the Redfin data, there were a total of 1,312 sales within the 11/23/2009 to 12/19/2009 period. 124 of these sales (9.5%) were flagged as a short sale.
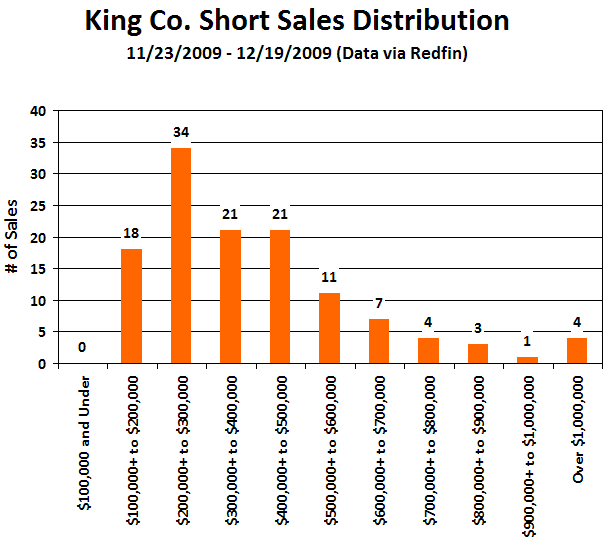
Here’s a histogram of the price breakdown for the 124 short sales in the last month:

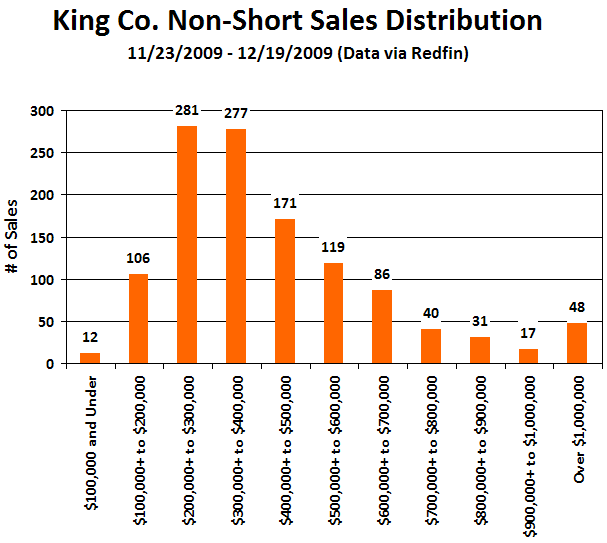
For comparison, here is a histogram of the 1,188 sales that were not marked as short sales:

42% of short sales in the past month were for homes that sold for $300,000 or less, while only 34% of non-short sales fell in that same price range. The biggest difference in the breakdowns above seems to be in the $300,000+ to $400,000 range. Above $400,000, there wasn’t much difference in the breakdown between short and non-short.
As for what is currently on the market, 16.4% of the 6,649 single-family active listings are marked as short sales.
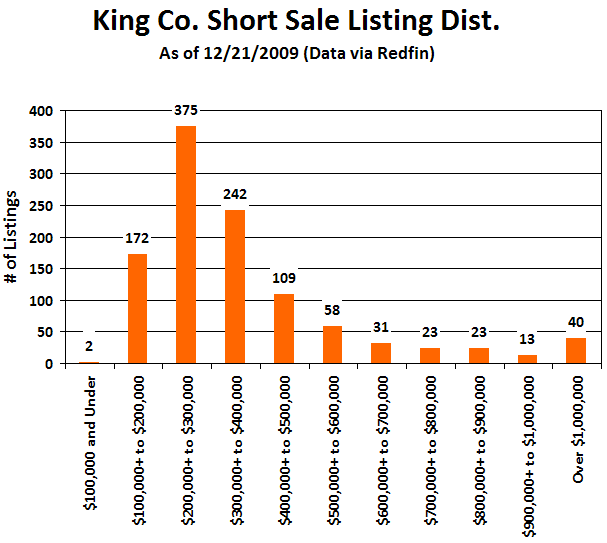
Here’s the histogram of asking prices for current short sale listings:

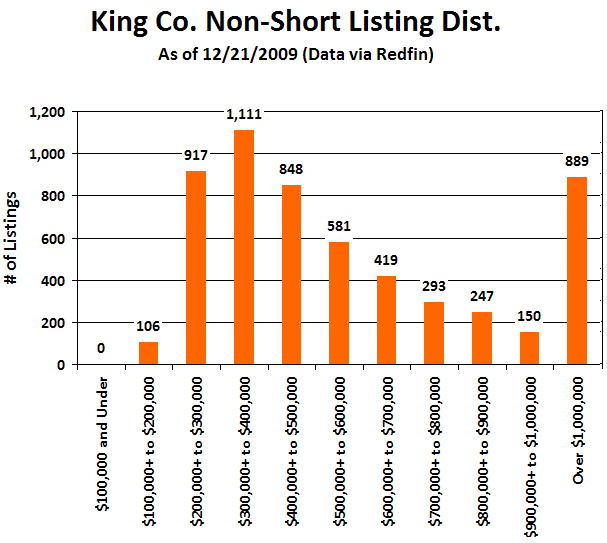
And here’s the histogram of asking prices for non-short sale listings:

Interesting difference between those two. Not much of a difference between the current listings and the solds on the short sales, though.
Looks to me like short sales are skewed slightly toward the low-end, both in listings and in closed sales. I also find it interesting what a large proportion of the active non-short listings are priced over a million (16%) vs. the proportion of closed non-short sales over a million (just 4%). Looks like a lot of wishful thinking out there in the high end of the market.