Since this month’s NWMLS press release focused on pending sales again, and there has been some discussion in the comments about what the relationship between pending and closed sales looks like in recent months, I thought it would be interesting to look at a few charts of the two data sets in a few different perspectives.
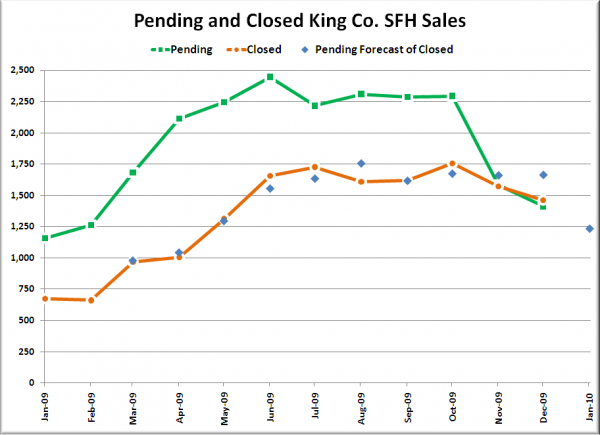
First up, here’s an update to one I posted last month, with the monthly pending and closed numbers as well as a forecast of closed sales based on a linear relationship with the pending sales from two months prior:
Not much change there. The closed sales for December came in a little lower than our linear forecast predicted, but not by a lot. I still expect January’s closed sales to drop below 1,250 based on this relationship.
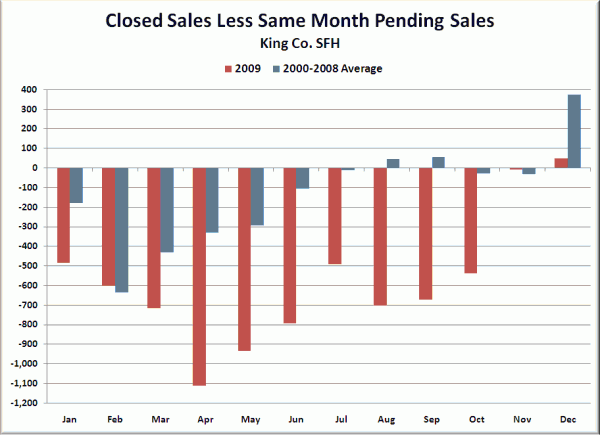
Next, here’s a chart of the difference between each month’s closed sales and that same month’s pending sales for 2009 as well as the average of 2000-2008:
Every month in 2009 but February and November came in with a significantly lower difference between the two than the nine-year average. This means a lower than usual number of closed sales compared to the number of pending sales, and December was no different.
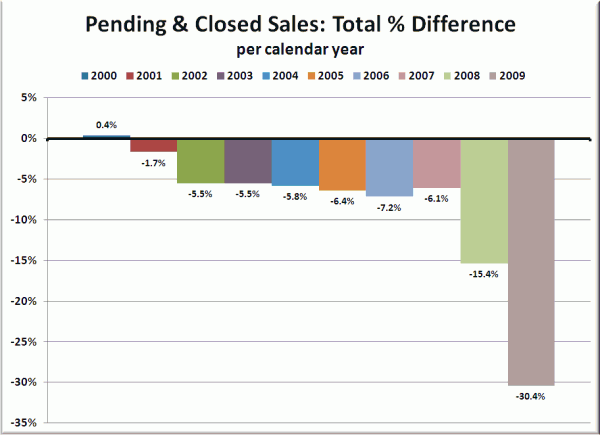
Lastly, here is a look at the total difference between calendar-year pending sales and closed sales for every year since 2000 (which is as far back as I have access to reliable data):
2008 had twice as high a difference than any year prior, and 2009 came in with over four times the discrepancy of any year 2000-2007.
So if you’re wondering why I continue to insist that pending sales have become a useless measure, wonder no more.


