Yesterday in our discussion about the wide variety of median price changes in neighborhoods around King County, a question came up: How can two thirds of the neighborhoods be experiencing median price declines but the county-wide median is basically flat?
This is a phenomenon we have addressed here in the past, but since it has been eight months since our last exploration of the subject, I thought it would be a good time for another brief refresher.
As you know, the median price is simply the middle point of all home sales in an area during a given month—the home sale which saw half the remaining sales come in at a higher price, and half at a lower price. This is a better measure than the average since it cannot be distorted by a single sale for tens of millions of dollars, but it does sometimes change in unintuitive ways as the mix of sales shifts from one area to another.
In order to explore this concept, we break King County down into three regions:
- low end: South County (areas 100-130 & 300-360)
- mid range: Seattle / North County (areas 140, 380-390, & 700-800)
- high end: Eastside (areas 500-600)
Here’s where each region’s median prices came in as of February’s data:
- low end: $215,475—$330,625
- mid range: $265,000—$617,000
- high end: $385,000—$1,325,000
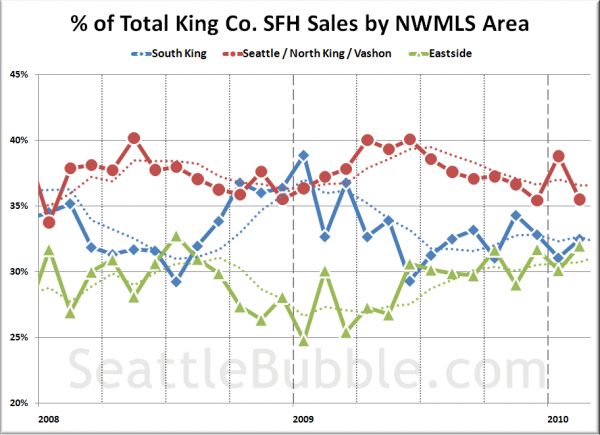
In the following chart I have plotted the percentage of each month’s closed sales that took place in each of the three regions. The dotted line is a four-month rolling average.
Over the past year, sales in the expensive Eastside have been steadily gaining share, taken from the least-expensive South County region in early 2009, and slowly eating away at the mid range Seattle / North County region in more recent months.
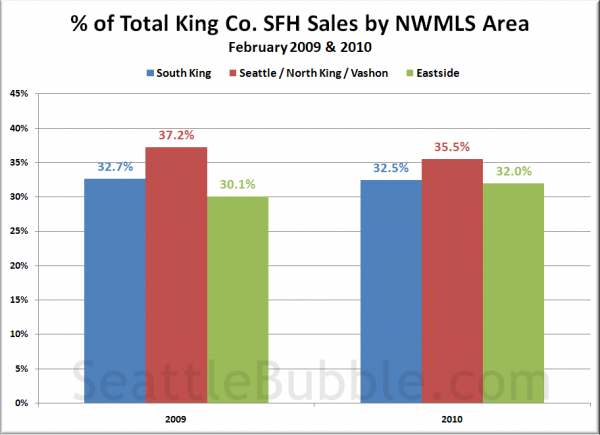
Here’s a look at just February 2009 and February 2010:
Compared to exactly a year ago, South King’s share of the sales held pretty steady, but two percentage points shifted from the mid-range Seattle region to the more expensive Eastside.
The result of this shift on the median price is likely to be a median in February 2010 that is slightly higher than the February 2009 median, even if every house were to have held completely steady in price during the year. In other words, February’s 0.5% YOY median price decline was probably a slight understatement of how much the prices of homes in King County have dropped in the last year.
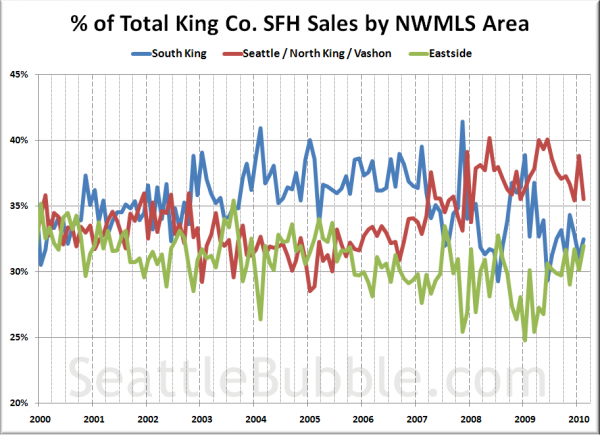
Lastly, here’s an updated look at this same set of data all the way back through 2000:
The big spike in sales in the low-priced South King region during the bubble years followed by a notable post-bubble increase in sales in the close-in Seattle region fits nicely with my theory that many home sales in the outlying regions were driven primarily by people jumping into the first place they could afford because they were afraid of being priced out of the market forever.
Now that prices getting more reasonable and people are realizing that buying real estate is not a sure-fire way to effortless riches through endless double-digit appreciation, people are buying where they really want to live long term.


