Since February employment numbers were just recently released here in Washington State, let’s check in again on the jobs situation around Seattle, courtesy of data from the Washington State Employment Security Department. The style of most of these charts are stolen from the excellent San Diego housing reporter Rich Toscano.
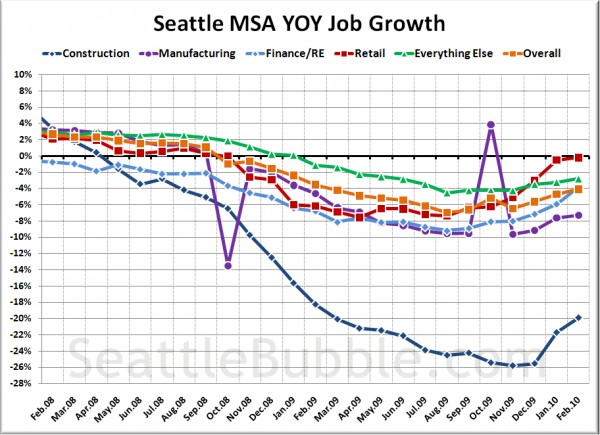
First up, here’s a two-year chart of the year-over-year change in some of the broad job categories related to housing (from my subscription journal Sound Housing Quarterly):
As of February, construction is still by far the hardest hit industry around Seattle, but the bleeding has lessened from 25% year-over-year losses to “just” a 20% loss as of February. Jobs are still being lost overall, but Retail has almost leveled off to zero.
And don’t ask me what’s the deal with the weird spikes in Manufacturing in October ’08 and ’09. It’s in the data from the state, and I have no idea what caused it.
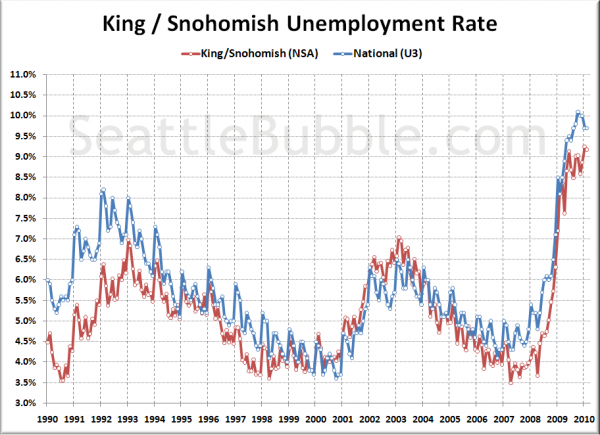
Here’s a look at the overall Seattle area unemployment rate compared to the national rate:
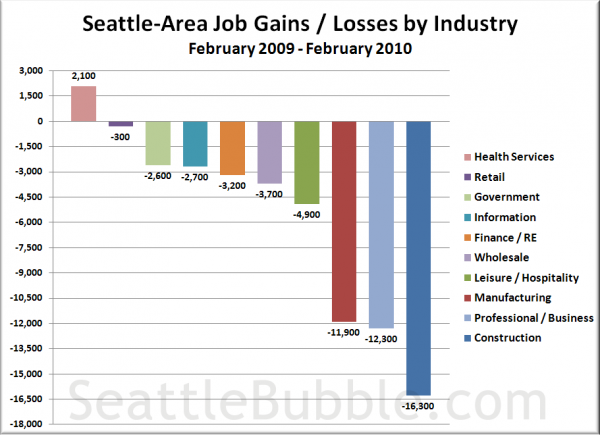
Next up, here’s a chart that shows the raw number of job gains or losses in the last 12 months in some of the largest Seattle-area industries:
Manufacturing, construction, and professional / business services are still shedding more jobs than any other industry in the Seattle area. Between the three, a total of 40,500 jobs have been lost in the last year. Health care was once again the only major sector that added jobs in the period.
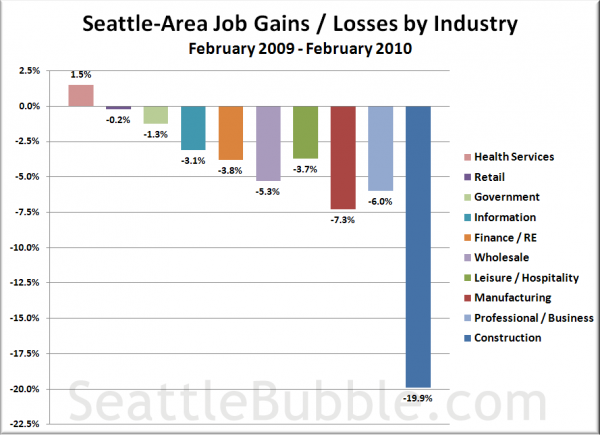
Here’s a look at the same data, broken down by the year-over-year percentage change, to give a better picture of the relative health of various industries:
Construction still sticks out like a sore thumb in this view, with the losses in other industries all falling in the single digits.
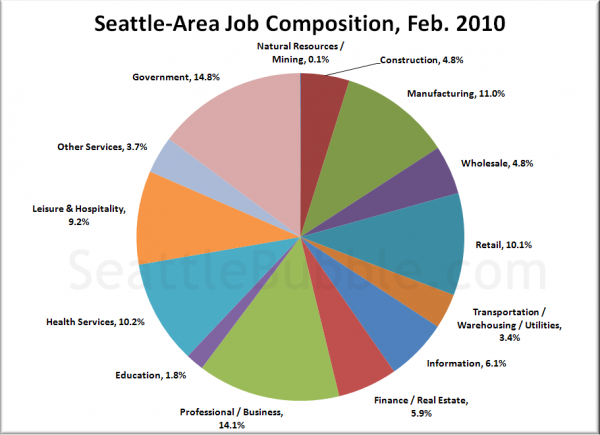
Lastly, here’s a big pie chart showing all major industries that make up Seattle’s job market, to give you some additional perspective to the above data:
