Looks like I haven’t posted this set of charts in nearly a year. With the first quarter behind us, I thought it might be instructive to give it a little context.
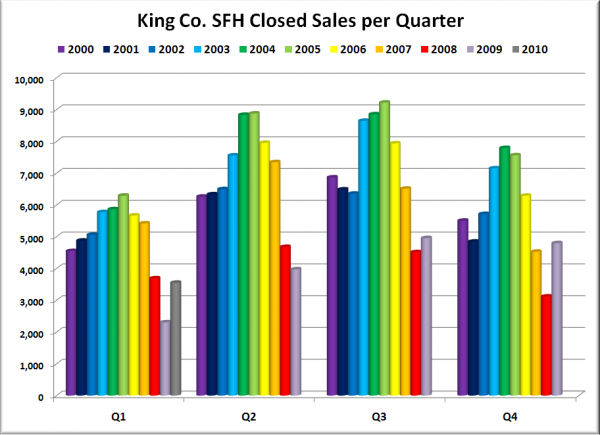
Here’s a look at quarterly closed sales of King County single-family homes from 2000 through 2010 Q1:
Q1 2010 easily trounced Q1 2009, but fell short of 2008. This is somewhat interesting considering that Q4 2009 surpassed Q4 2008 by a wide margin and even beat Q4 2007.
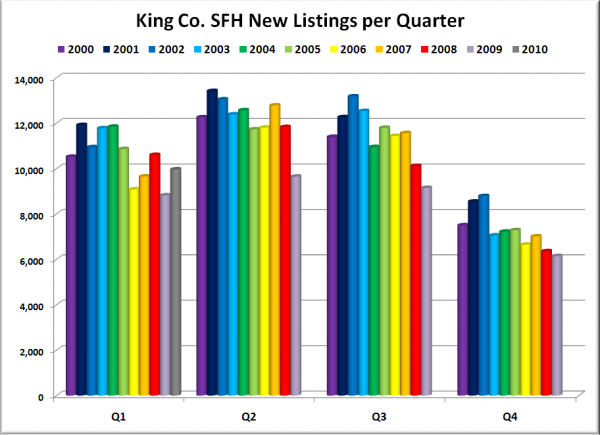
Here’s the same view of total new listings:
It would appear that the talk of a recovery in the housing market is at least enough to convince more home owners to list than a year ago.
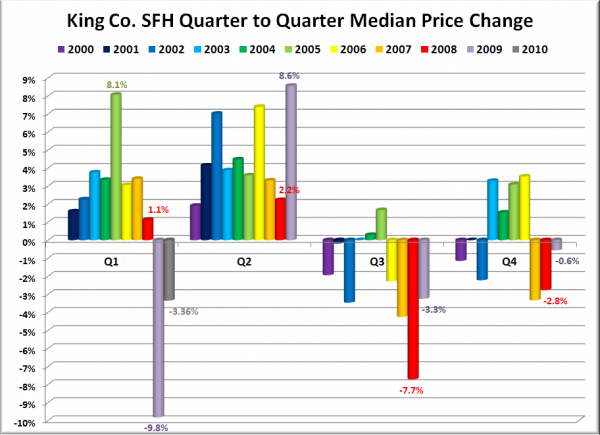
And lastly, just for fun, here’s a look at the quarter-to-quarter change in the median price for each quarter since Q1 2000:
Q1 was definitely not as extreme as a year ago, but it was still the second-worst to date. It will be interesting to see how Q2 shapes up, especially since the tax credit is expiring, and last year the newly-minted tax credit pushed prices up fast enought to set a new record.


