There has been a bit of talk in the last few days about a New York Times story published on Tuesday that once again revisits the subject of buying vs. renting: In Sour Home Market, Buying Often Beats Renting
In some once bubbly markets, prices have fallen so far that buying a home appears to be a bargain, based on a New York Times analysis of prices and rents in 54 metropolitan areas. In South Florida, Phoenix and Las Vegas, house prices — relative to rents — are as low as in places that never experienced a bubble, like Indianapolis and St. Louis.
But in a handful of other areas, including San Francisco, Seattle and Portland, Ore., house prices remain significantly higher than they were before the bubble began. People who buy a home in these areas will face higher monthly costs than if they rented, even after taking tax deductions into account. As a result, buyers are effectively betting that prices will rise enough in future years to cover the difference.
A similar AP article from the day before (apparently based on a separate study) tells the same story: Should You Buy or Rent a Home? Cost Gap Narrows
Renting remains far more affordable than owning in traditionally pricer markets such as New York. In Manhattan, the gap is more than $4,000. Renters will save $1,000 or more a month in metro areas such as Los Angeles, Seattle, San Diego, San Francisco, and San Jose, Calif.
The New York Times article includes a nifty chart of the price to rent ratio of 46 metro areas around the country. Their chart of five metro areas in the west is shown at right in the quote above. They also published an updated version of their excellent buy vs. rent calculator that we have recommended here numerous times in the past.
We have visited the rent-vs-buy discussion here many times before, most recently in August, October, and January. I’m not really interested in rehashing everything that has already been said on these pages in recent months, but I will attempt to add some new thoughts to the discussion of this week’s articles.
First up, I wanted to point out a post by local title/escrow company The Talon Group in which Chris Lodge attempts to debunk the New York Times’ claim that Seattle’s price-to-rent ratio is still unusually high.
The rent vs buy ratio they use seemed simple enough to calculate. We just need the average sales prices in an area along with what the annual rents are for the same area.
For March, we found that we had an average sales price in Seattle of $493,971.
Average Rent, according to rentbits.com, were $2069 for all home rentals in Seattle. On a side note, here’s a graph of the rental rates for Seattle as well going back 12 months.
Using the NY Times model above, lets put in our own calculations:
$493,971/($2069*12) = 19.89.
Thats right, we come in right at the benchmark of where you should think about buying rather than renting.
While I appreciate Chris’ attempt to run the numbers for himself, there are a couple things that are missing from his assessment. In order to get any really useful information from the price-to-rent ratio, you need to have something to compare today’s data point to. This means running the ratio using the same data sets for price and rent over a long period of time. Today’s ratio of 19.89 according to Chris’ sources doesn’t really tell us anything, because we don’t know what those same data sources would have put the ratio at last year, two years ago, five years ago, etc.
The other thing that Chris seems to be ignoring is that the New York Times ran their ratios for 46 regions across the entire country. Speaking from experience, I can tell you that it is very tricky to find data sets that are uniformly available for that many metro areas. Running Seattle’s ratio with Chris’ particular data set and coming up with 19.89 doesn’t tell us how Seattle’s ratio compares to all the other cities, which was half the point of the New York Times article.
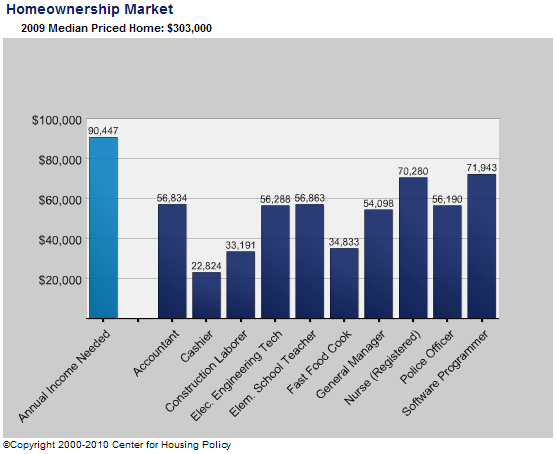
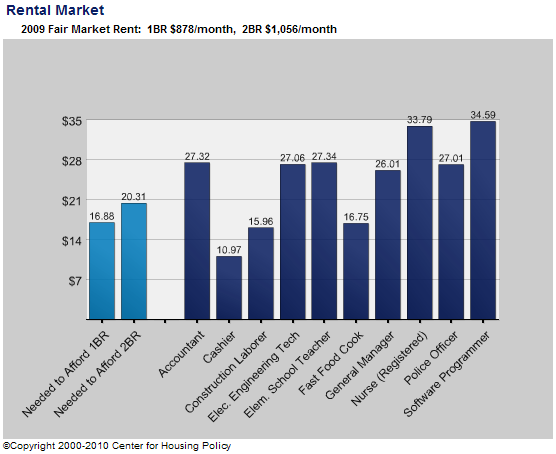
Moving on… Let’s get a little more context on the buy-vs-rent discussion. Over at the Center for Housing Policy they have a nifty online tool that allows you to compare the costs of buying or renting a home to the average income of various professions.
Here’s what the buying situation looks like for an assortment of ten occupations:
Now compare that to the rental picture for those same jobs:
So is someone really going to sit there and try to tell me with a straight face that renting is still not the most financially sensible choice for most people in the Seattle area? Granted, things are a lot less out of whack than they were in 2006 and 2007, but in many neighborhoods around Seattle there is still really no comparison. Everett, Federal Way, Kent… it may make sense to buy. But close-in, in Seattle, Bellevue, or Kirkland, the scales are definitely still tipped in favor of renting.

