A reader emailed last week, requesting some information on the historic rate of price growth for King County home prices, in order to make a more educated guess when making buy-vs-rent calculations.
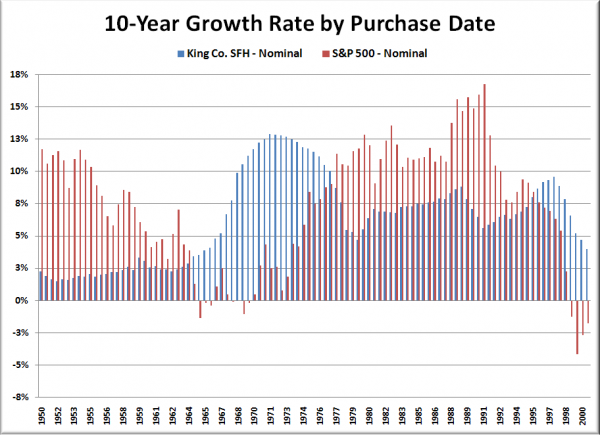
To that end, I am providing the following charts and table. First up is the average growth rate for King County Single-Family homes for the ten years following the purchase dates shown across the X-axis, back through 1950. For comparison I have included the growth rate for the S&P 500 over the same period.
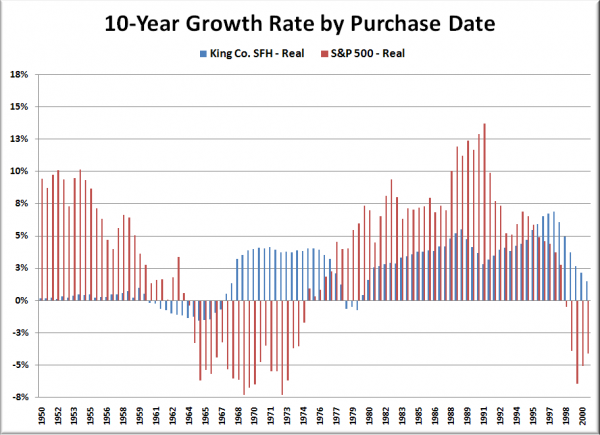
And here’s what that chart looks like if you adjust prices for inflation based on the CPI.
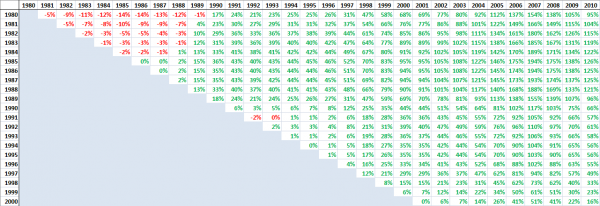
Lastly, here’s a table that shows the total inflation-adjusted growth in King County home prices, beginning in 1980 and ending in 2010. Pick a purchase date on the left side, then follow that row left to right across the years to see the total growth from that purchase date to the end dates in each column.
The average growth rate over any 10 year span for nominal King County SFH prices from 1950 through 2010 is 6.4%. For the S&P 500, the average is 7.4%. In the 50-year span covered by the two charts above, the average 10-year rate of return of the S&P 500 beat King County SFH prices in 32 years, while King Couty SFH came out on top in 18.
Obviously this is not a complete comparison of the pros and cons of investing in real estate vs. the stock market, nor is it intended to be. The only purpose of this post is to try to help people get some idea of what kind of growth rates might be reasonable to assume when trying to make decisions about buying, renting, and investing.


