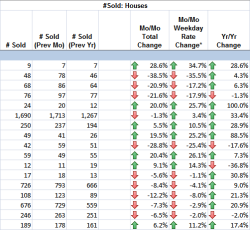
Local internet real estate technology powerhouse and discount brokerage Redfin has taken a page from the NWMLS playbook, torn it out, shredded it, burned it, flushed it down the toilet, and written a whole new book from scratch on the subject of monthly data releases.
 In their first data release for the Seattle area, they dig into inventory, sales volume, and prices for King County and a number of specific cities. While the blog post contains a good amount of info, the detailed spreadsheet is where the real action is at.
In the spreadsheet they break down inventory, listing prices, sales volume, and sold prices, including price per square foot. The data is broken down by county (17 counties total), by city, and by neighborhood. Sweet!
Unfortunately, since they’re just getting started with this, there isn’t enough data available yet to generate any interesting charts, so instead here’s a quick comparison of May data from the NWMLS and comparable data from Redfin on King County SFH:
| May 2010 | Redfin | NWMLS |
|---|---|---|
| Active Listings | 10,234 | 9,497 |
| Listings YOY | -8.8% | -3.6% |
| Closed Sales | 1,690 | 1,766 |
| Sales YOY | +33.4% | +34.6% |
| Median Price | $384,500 | $379,000 |
| Price YOY | +2.5% | +1.1% |
| Med. $/sqft | $209 | – |
I’ll definitely be keeping an eye on this new data from Redfin as it is released each month.