We spend a lot of time on here talking about month-to-month changes in this or that index, looking for signs of what’s coming next in the housing market. This close scrutiny certainly has its place, but sometimes it’s helpful to take a step back and look at things in more of a long-term historical context.
This week we’ll spend some time looking at a handful of metrics related to Seattle-area home prices and local economic fundamentals to see if we can get a feel for where we stand right now, and where we might be headed over the next few years.
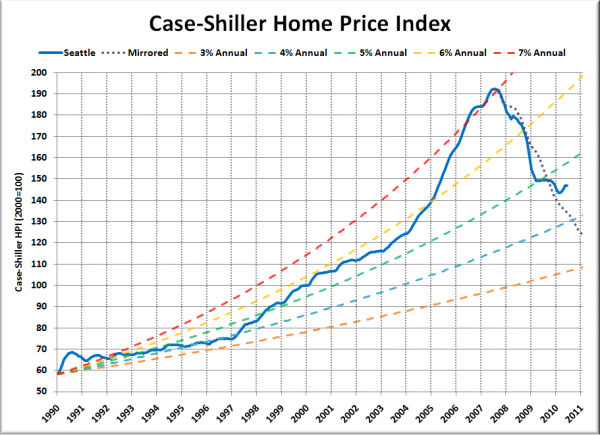
First up, let’s have a look Seattle’s Case-Shiller Home Price Index, compared to a variety of steady rates of annual price increases.
Despite the little mini-bubble that local home prices experienced in 1990, through about 1996, Seattle home prices were tracking at a rate of about 4% annual increases. From 1997 through 2003, things began to get a little detached, then the train wreck really picked up steam in 2004.
The dotted purple line in the chart above shows what the bursting bubble would have looked like if prices declined in the same pattern they rose. As you can see, even with the interference of the tax credit, Seattle’s decline is still fairly close to a mirror image of the increase.
Seattle’s Case-Shiller Home Price Index currently sits at a level that represents 4.6% annual increases since 1990. For comparison, if a family earning the median household income in 1990 in King County of $38,676 were to have received 4.6% annual increases since then, they would currently be earning $97,524. Here in the real world, OFM’s latest estimate (2009) puts the median household income in King County at $62,810 (equivalent to an annual increase of 2.6%).
So, where does that put us today? Seattle home prices certainly are not as insanely out of whack as they were 2005-2007, but have they reached an equilibrium yet? Based on this analysis, I’m inclined to say “not quite.” What about you?
Big Picture Week on Seattle Bubble
- Case-Shiller HPI Rate of Increase
- Examining Home Affordability
- Price to Rent Ratio
- Price to Income Ratio
- Unemployment and Foreclosures
