Yesterday TheHulk brought up an interesting idea in the comments:
Whenever I look at listings online, for older houses (aka houses built before 2000), in my mind I make up a figure on what that house price should be today. My stupid back-of-the-envelope calculation is as follows:
Current price – 500K
Last Sold – 250K in 1998Price today should be – 250K * (1 + (Average Inflation from 1998 to Current year)* (Current year – 1998) )
David Losh agreed:
That has been my thinking from the beginning, go back to 1998 and add in inflation.
…
I do use 1998 as the golden rule of value.
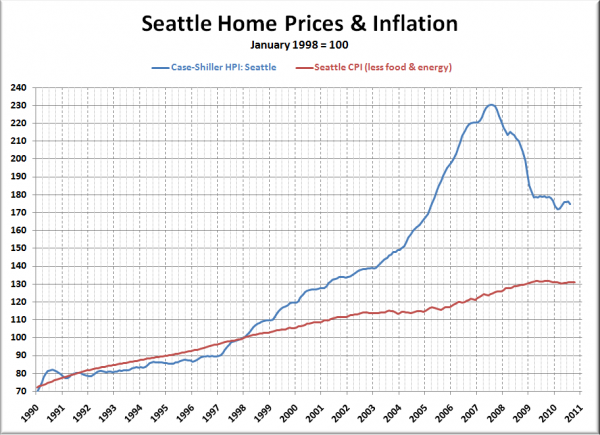
It’s an attractive idea because it is so simple, and so logical. It is also a perfect excuse for me to generate a pretty graph. So, here it is:
Inflation here in the Seattle area (according to the Bureau of Labor Statistics) has averaged 1.81% per year. If you assume that home prices were fair in 1998 and any increase since then above inflation is excess, then home prices around today are still roughly 33% overpriced. Yikes!
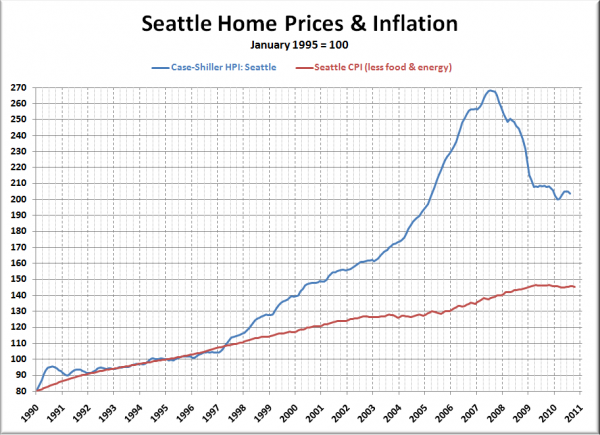
Of course, if you really want to match the inflation line up with the Case-Shiller home price trend line through most of the ’90s, 1995 is a better choice to index to:
If 1995 was a fair price and anything above inflation is set to be given back, home prices are still nearly 40% overvalued.
Personally, I don’t think the simple inflation calculation tells the whole story. As I explained during Big Picture Week back in September, I think most of the strong home price gains in Seattle from 1997 through 2000 were supported by a strong increase in our per capita income—a fundamental shift in the local economy that justifiably pushed prices up a notch.
Personally I think it’s difficult to make a strong case for the home price bubble beginning much earlier than 2001 here in Seattle. Unless all those high-dollar tech salaries disappear, I don’t think we’re very likely to see local home prices drop below the level of 2001 prices + inflation.
When you re-index the charts above to January 2001, home prices today are only about 14% higher than inflation would suggest they should be, which seems a lot more likely to me, when you look at home prices compared to the whole host of underlying economic fundamentals including inflation, incomes, rent, employment, etc.

