With February but a memory fading away in our grey matter, it’s time for another monthly stats preview. Most of the charts below are based on broad county-wide data that is available through a simple search of King County and Snohomish County public records. If you have additional stats you’d like to see in the preview, drop a line in the comments and I’ll see what I can do.
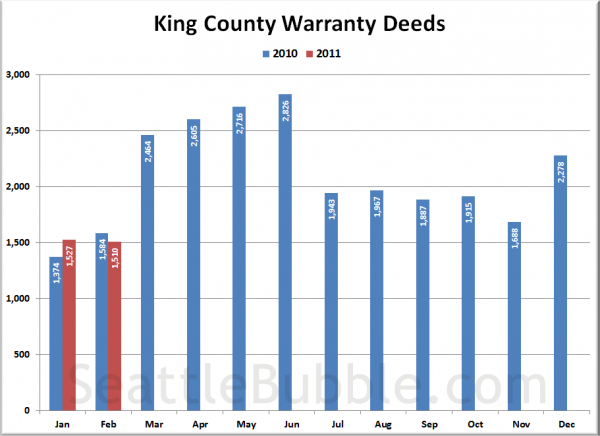
First up, total home sales as measured by the number of “Warranty Deeds” filed with King County:
Warranty Deeds fell slightly from January’s level, coming in about 5% lower than a year ago. Last year Warranty Deeds rose 15% during the same month. Based on this data we should see NWMLS-reported SFH closed sales for February come in right around 1,000 again (barring an excess of late-reporting nonsense).
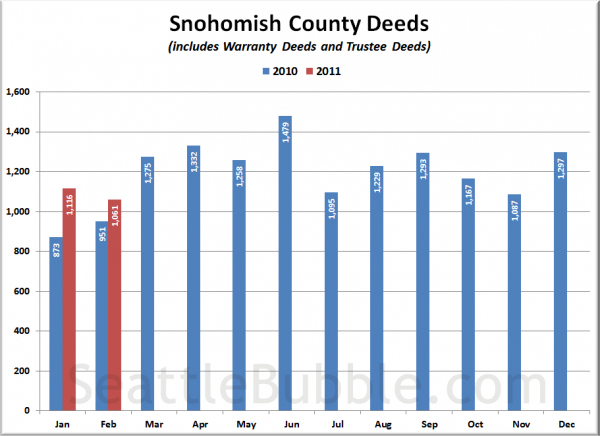
Here’s a look at Snohomish County Deeds, but keep in mind that Snohomish County files Warranty Deeds (regular sales) and Trustee Deeds (bank foreclosure repossessions) together under the category of “Deeds (except QCDS),” so this chart is not as good a measure of plain vanilla sales as the Warranty Deed only data we have in King County.
Overall deeds fell month to month in Snohomish, but rose from a year ago.
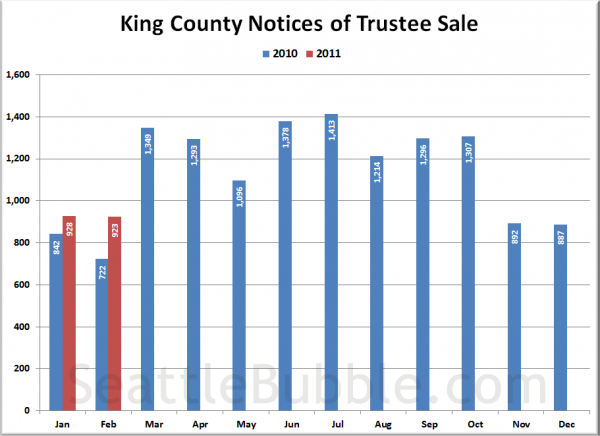
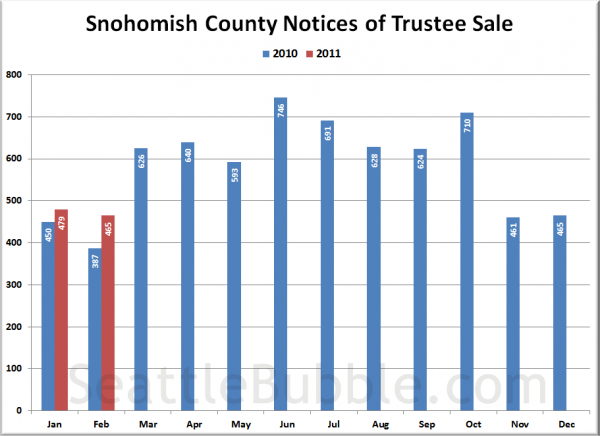
Next, here’s Notices of Trustee Sale, which are an indication of the number of homes currently in the foreclosure process:
Given that we had three fewer days in February, it’s not too surprising to see both counties post a slight drop month-to-month, but they were both up over 20% from a year ago, which seems to indicate that the “foreclosure crisis” is not quite over yet.
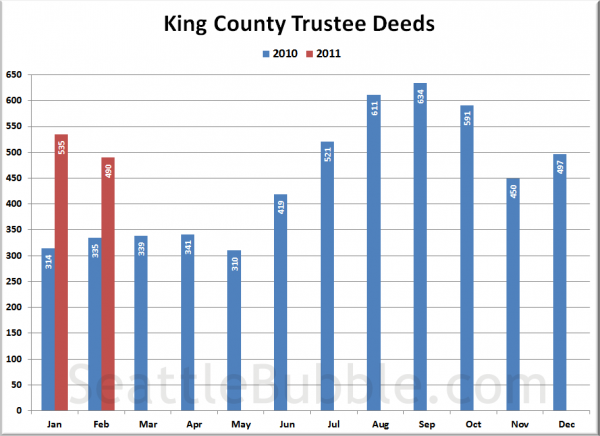
Here’s another measure of foreclosures for King County, looking at Trustee Deeds, which is the type of document filed with the county when the bank actually repossesses a house through the trustee auction process. Note that there are other ways for the bank to repossess a house that result in different documents being filed, such as when a borrower “turns in the keys” and files a “Deed in Lieu of Foreclosure.”
Also down month-over-month, but up over 46% from a year ago.
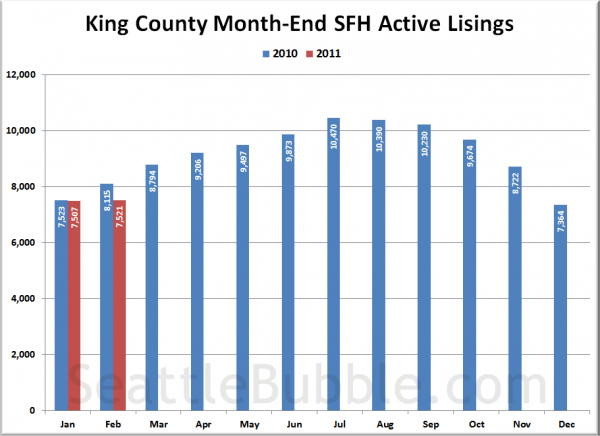
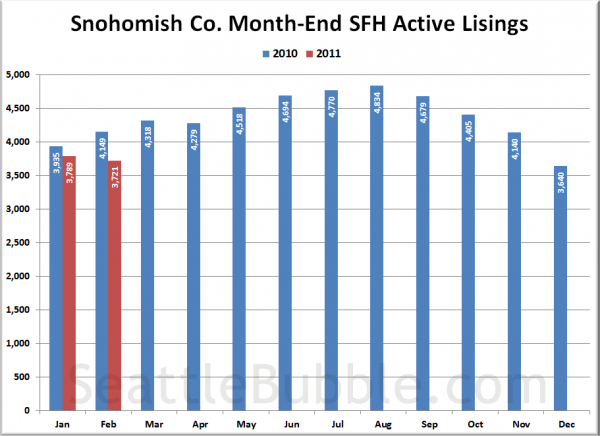
Lastly, here’s an approximate guess at where the month-end inventory was, based on our sidebar inventory tracker (powered by Estately):
Still moving in the opposite direction of what we normally see this time of year. It looks like many area sellers have moved into the “acceptance” phase, not even bothering to list their homes at fantasy prices because they know there is no way they will be able to get as much as they need or want for their home.
Stay tuned later this month a for more detailed look at each of these metrics as the “official” data is released from various sources.
