The latest issue of Sound Housing Quarterly has been published (Q1 2011). Sound Housing Quarterly is a subscription-based sister project to Seattle Bubble that I created to provide a single consolidated and consistent source of high-level local housing market stats and analysis.
This month’s report sports 49 pages packed with unique housing market insights you won’t find anywhere else. Far from being a rehash of the material posted here on the blog, Sound Housing Quarterly is a unique collection of charts, tables, data, analysis, and predictions that I compile every quarter specifically for this project. Here are a couple of highlights from the first quarter issue.
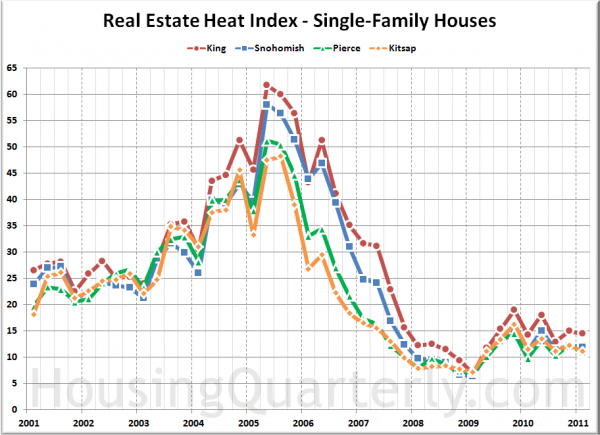
The Real Estate Heat Index (a proprietary index I created that uses supply, demand, and home prices to calculate the general “heat” of the housing market) dipped a bit in Q1 in all eight of the Puget Sound Counties I track. Here’s a look at King, Snohomish, Pierce, and Kitsap:
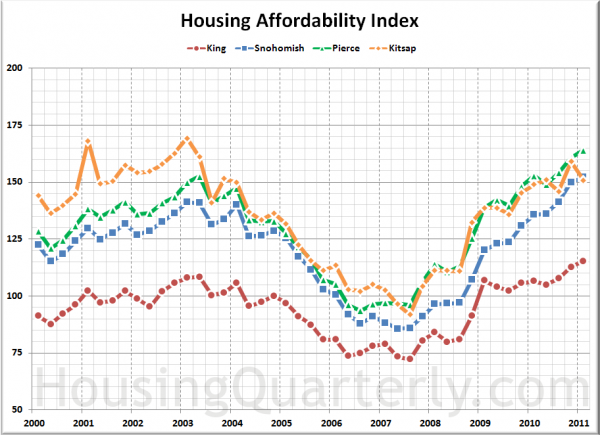
Meanwhile, affordability rose everywhere but Kitsap and Island, thanks to the continued decline in median home prices, as well as still-ridiculously-low mortgage interest rates:
The full version of Sound Housing Quarterly includes detailed data and analysis for King, Snohomish, Pierce, Kitsap, Thurston, Island, Skagit, and Whatcom counties.
Head over to HousingQuarterly.com to subscribe to Sound Housing Quarterly. You can also download a free single-page summary of this quarter’s report, or drop by the free archive to check out the 2008 Q3 through 2010 Q1 reports in full at no charge.

