It’s time yet again to check in on our monthly stats preview for King and Snohomish counties. Most of the charts below are based on broad county-wide data that is available through a simple search of King County and Snohomish County public records. If you have additional stats you’d like to see in the preview, drop a line in the comments and I’ll see what I can do.
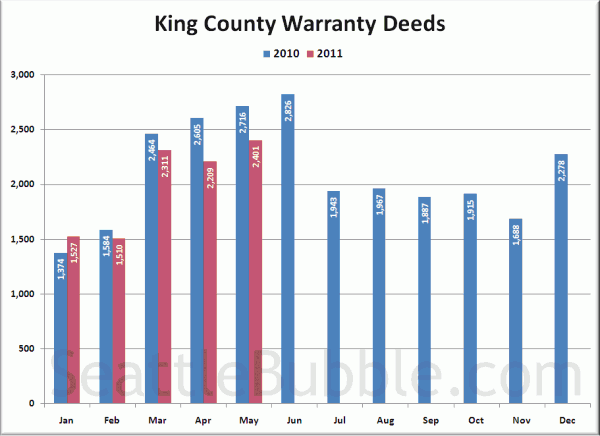
First up, total home sales as measured by the number of “Warranty Deeds” filed with King County:
Still down fairly substantially from last year’s mad rush to beat the tax credit deadline. Not the lowest May on record though. May 2011 beat out May 2009 (which had just 1,929 WD) for that title.
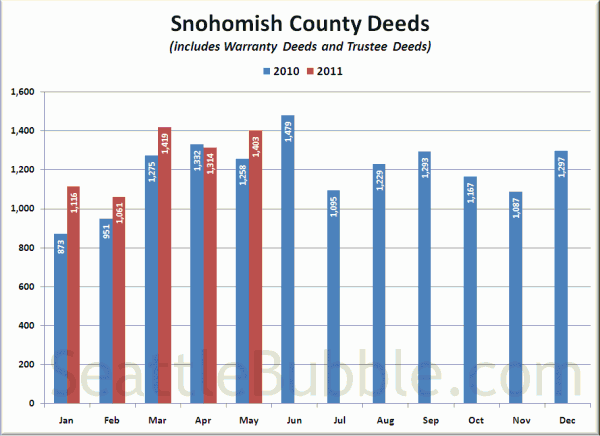
Here’s a look at Snohomish County Deeds, but keep in mind that Snohomish County files Warranty Deeds (regular sales) and Trustee Deeds (bank foreclosure repossessions) together under the category of “Deeds (except QCDS),” so this chart is not as good a measure of plain vanilla sales as the Warranty Deed only data we have in King County.
Strange pattern we’ve seen most of the year—Deeds are up about 10% from last year, even though closed sales have been falling fairly consistently. Must be an increase in the number of Trustee Deeds rather than Warranty Deeds. On a related note, you’ll be reading a lot more about one of those 1,403 Deeds in the coming weeks…
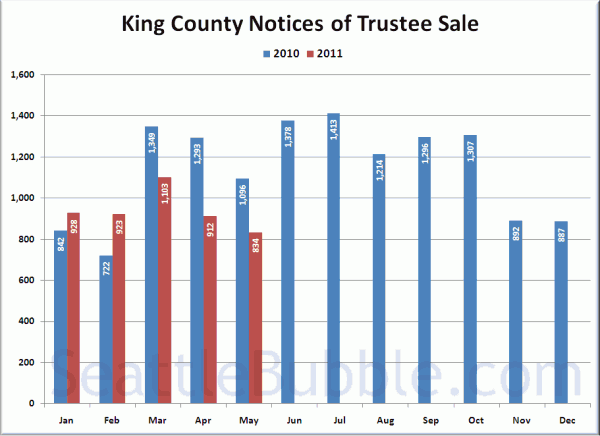
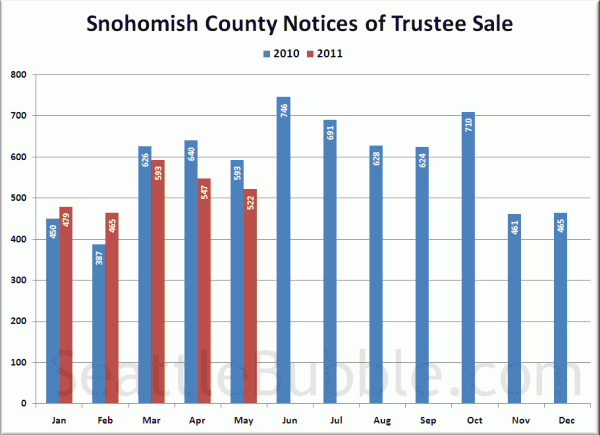
Next, here’s Notices of Trustee Sale, which are an indication of the number of homes currently in the foreclosure process:
Trending down month-to-month and year-over-year in both counties for three months straight. Possibly a trend pointing toward recovery, or possibly just another legislation-induced glitch.
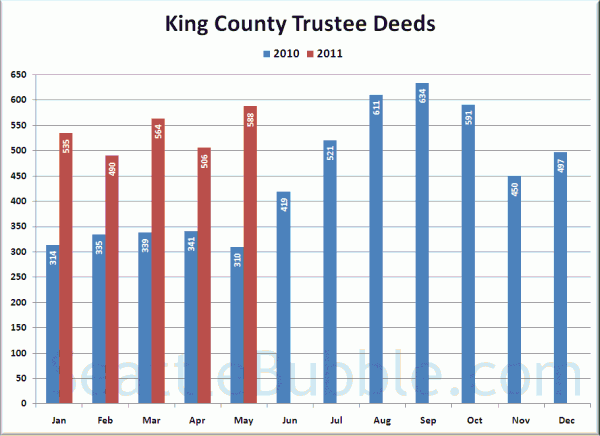
Here’s another measure of foreclosures for King County, looking at Trustee Deeds, which is the type of document filed with the county when the bank actually repossesses a house through the trustee auction process. Note that there are other ways for the bank to repossess a house that result in different documents being filed, such as when a borrower “turns in the keys” and files a “Deed in Lieu of Foreclosure.”
Meanwhile, although homes entering the foreclosure pipeline seem to be decreasing, there’s no noticeable drop in the number of homes actually being repossessed by the bank.
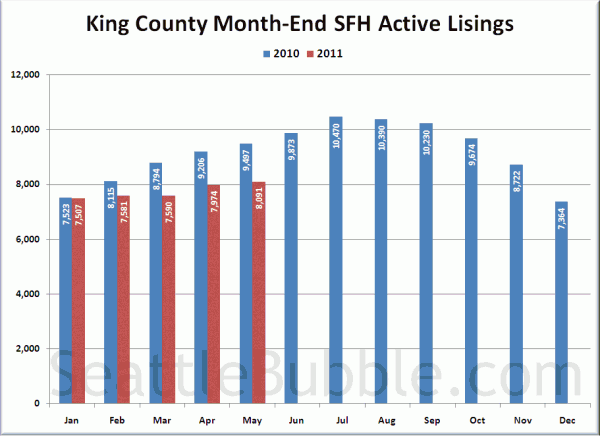
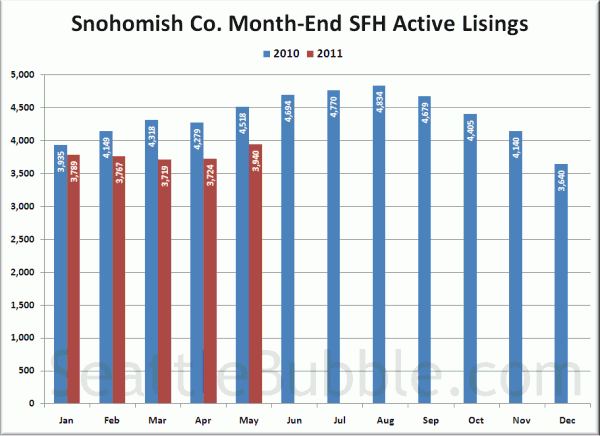
Lastly, here’s an update of the inventory charts, updated with the inventory data from the NWMLS.
First semi-decent increase in inventory all year in both King and Snohomish. Finally starting to see a little selection out there.
Stay tuned later this month a for more detailed look at each of these metrics as the “official” data is released from various sources.
