Wow, has it really been three months since I posted the national Case-Shiller losses map? I guess so! Sounds like it’s time for a refresh.
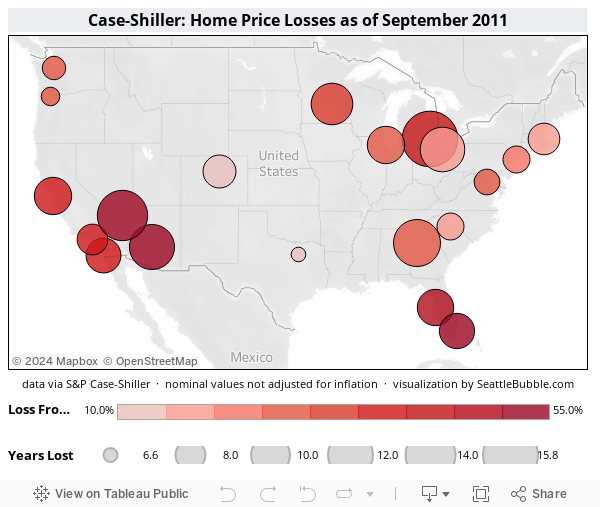
In the map below I’ve put the Case-Shiller home price index data from all twenty cities on a map. The size of each circle represents how far back prices have rewound (larger = further back), and the circles are color-coded by how much prices have fallen from their peak value. Float over a circle for the details about that city.
As an added bonus, here’s a simple plot of Seattle’s Case-Shiller HPI both as-published and adjusted for inflation (using Seattle’s CPI) from the beginning of the index in January 1990:

Real home prices for Seattle are roughly equal to where they were in March of 2000. Yipes.
On the plus side, I tried to make a switcher for the map above that would allow you to flip between real and nominal drops for all twenty cities, but there were too many cities that have fallen so far that their real home prices are well below where they were at the oldest point in the Case-Shiller data (January 1987 for some markets). At least Seattle wasn’t one of them!