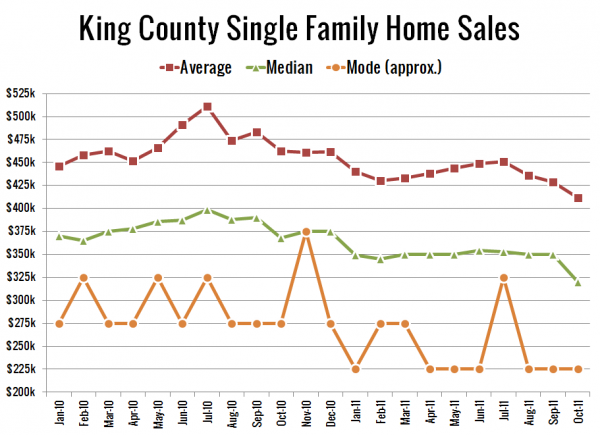
Here’s a data set that I pulled a while ago and apparently forgot to post. In the chart below, in addition to the median price metric that we usually focus on, I’ve plotted the average price as well as the mode (after bucketing prices into $50k ranges):
What’s interesting to me about this chart is that although the median price took a big dip in October after holding dead steady between January and September, the average price had actually been on the decline since August, and the mode price dropped to a new low plateau way back in April.
Looking at this data, October’s drop in median price probably shouldn’t have come as a surprise. Perhaps the only surprising part is that the median didn’t start to fall sooner.
