Let’s take another look at the King County single-family sale price percentiles.
Here’s how I break down the price percentiles for these posts. Each bucket is a cutoff where some percentage of homes sold below that price, while the remaining percentage sold above that price.
- Bottom: 10% below, 90% above.
- Low: 25% below, 75% above.
- Median: 50% below, 50% above.
- High: 75% below, 25% above.
- Top: 90% below, 10% above.
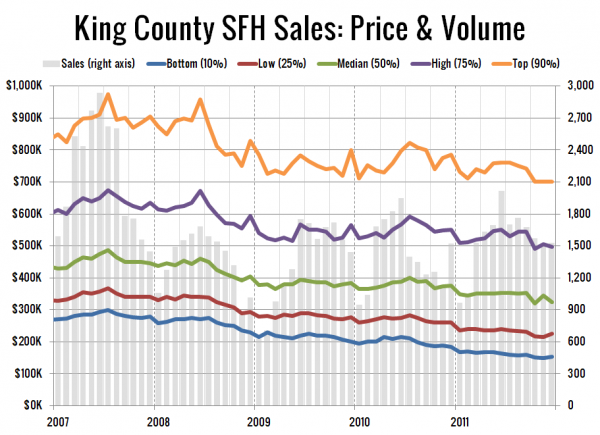
First up, a long-term view of the five percentiles, going all the way back to January 2007, shortly before King County’s peak pricing.
In December, 45% of homes sold for under $300,000 (the 10th percentile level at the peak). Meanwhile, the median price at the peak ($481,000) is roughly where the 75th percentile sits in December.
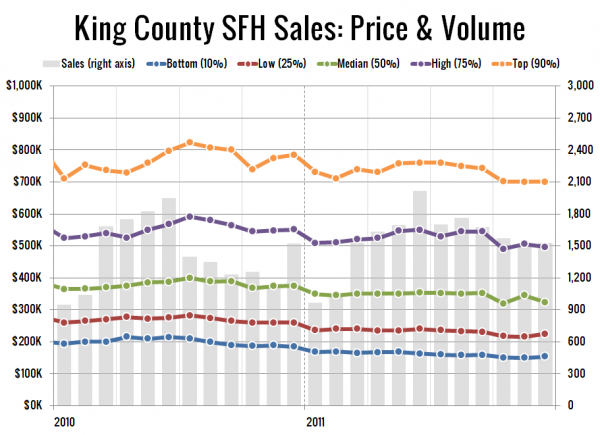
Here’s a closeup look at just 2010 and 2011:
All five tiers have been relatively flat since the drop down in October. Here’s where all five percentiles fall compared to their respective peaks as of December:
- Bottom: 49% off peak
- Low: 39% off peak
- Median: 34% off peak
- High: 26% off peak
- Top: 28% off peak
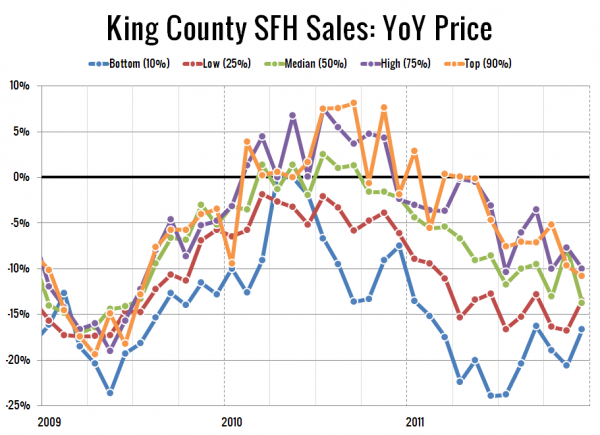
Lastly, here’s a look at the year-over-year price changes in each of the five percentiles.
And here’s where they stand as of December:
- Bottom: down 17%
- Low: down 13%
- Median: down 14%
- High: down 10%
- Top: down 11%
December was the first month since July 2009 that all five tiers are in double-digit negative territory.


