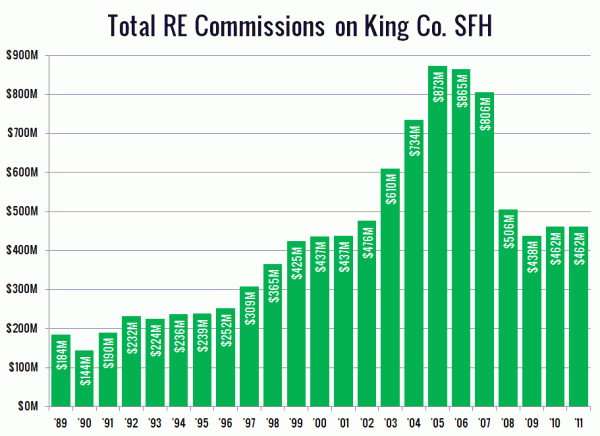
Here’s a different take on sales and price data that I found interesting. I took the total sales volume of single-family homes in King County for each year and multiplied it by the full-year average sale price, then took six percent of that amount to arrive at a total amount of potential commission paid to real estate agents each year since 1989.
Although prices did not peak until 2007, sales volume had already been on the decline for two years by then, causing commissions to peak in 2005. Total commissions (potentially) paid to real estate agents has fallen by 47% in the six years since the peak.
However, I find it interesting that despite the big drop, agents in 2011 still took in nearly double the average $237M they got each year between 1992 and 1996, on ten percent fewer sales. Not a bad deal at all, if you ask me.
If you’re curious to play around with the numbers I used to generate the chart in this post, you can download the spreadsheet and tinker to your heart’s content. Enjoy!
