Skip to content

Seattle Bubble

local real estate news, statistics, and commentary without the sales spin.

Menu
  • Home
  • About
  • Contact
  • Reference
  • Speaking
Menu

Inflation-Adjusted Commissions Up 25% From Pre-Boom

Posted on January 23, 2012January 23, 2012 by The Tim

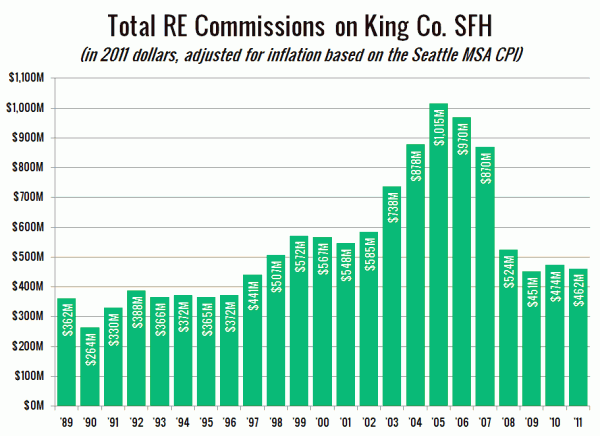
By request of ChrisM and Alex, I ran the commission numbers I posted Friday through an inflation-adjustment. The chart below plots the total yearly commissions on single-family home sales in King County in 2011 dollars, adjusted based on the Bureau of Labor Statistics Consumer Price Index for the Seattle area (series CUURA423SA0).

Total Real Estate Commissions on King County SFH (inflation-adjusted)

After you adjust for inflation, commissions in recent years are down 55% from the 2005 peak and lower than they have been since 1998. However, they are still up 24% from the average amount of potential commissions collected through the pre-boom years of 1992-1996.

Update:
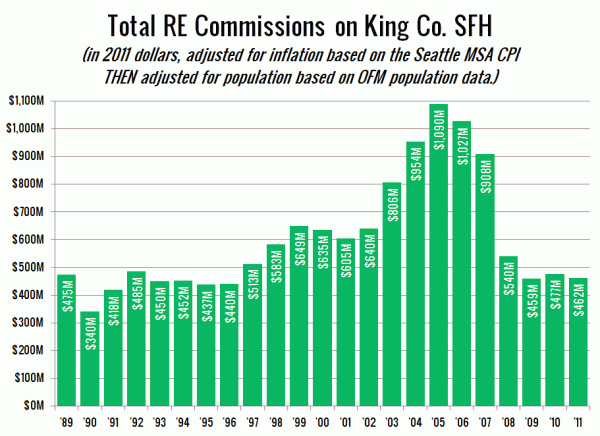
Sure, wait until I post this to make an additional request that I adjust for inflation and population. Here you go!

Total Real Estate Commissions on King County SFH (inflation and population-adjusted)

After adjusting for population, commissions are down 58% from the 2005 peak, and basically the same as where they were from 1992 to 1996 (up 2%).
Share:

  • Twitter
  • LinkedIn
  • Facebook
  • Reddit
  • Pinterest
  • Email

Continue Reading

Next Post:
Total Commissions Cut in Half Since 2005 Peak
Previous Post:
Reader Question: Can I Negotiate a Commission Discount?

Tim’s Other Projects

Dispatches from the Multiverse

Tip Jar

Like what we're doing?

Drop us a tip!

Accounts

  • Log in
  • Entries feed
  • Comments feed
  • WordPress.org
©2025 Seattle Bubble | Built using WordPress and Responsive Blogily theme by Superb