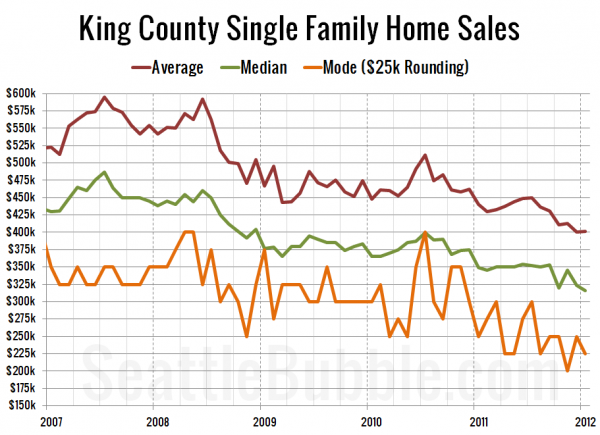
It’s been a few months since we took a look at the average, median, and mode prices all together, so let’s update that chart. One note, I thought of a way to improve on my estimate of mode price (definition of mode). Instead of generating a histogram of sale prices, then taking the midpoint of the bucket with the most sales, this time I rounded every sale price to the nearest $25,000, then took the mode of that set.
As of January, the median price is down 35.2% from its July 2007 peak, the average is down 32.5% from its July 2007 peak, and the $25k-rounded mode is down 43.8% from its April-May 2008 peak. Looks like lots of people are scooping up the cheap stuff.
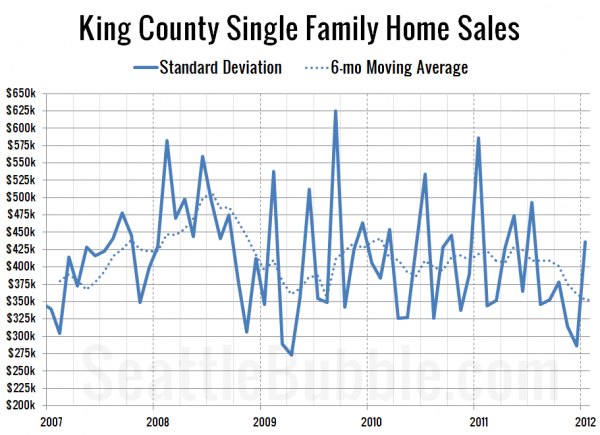
Hit the jump for the plot of the standard deviation, requested by the serious data geeks.
Still no conclusive trend on the standard deviation. In theory, a decreasing standard deviation would indicate a narrowing of the range of prices that buyers are paying for homes. We did have a good-sized decrease between July and December, but it shot back up in January, so who knows what’s going on there.


