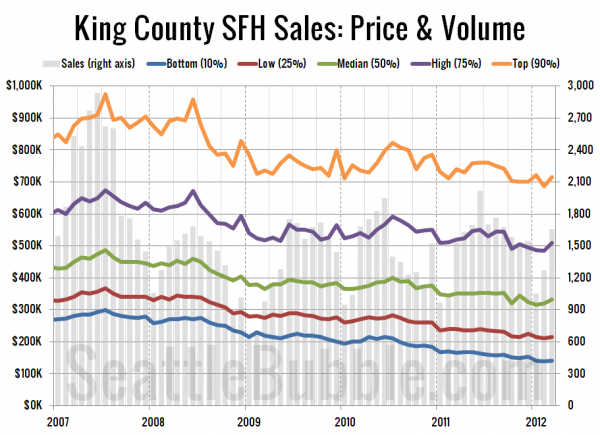
Let’s take another look at the King County single-family sale price percentiles.
Here’s how I break down the price percentiles for these posts. Each bucket is a cutoff where some percentage of homes sold below that price, while the remaining percentage sold above that price.
- Bottom: 10% below, 90% above.
- Low: 25% below, 75% above.
- Median: 50% below, 50% above.
- High: 75% below, 25% above.
- Top: 90% below, 10% above.
First up, a long-term view of the five percentiles, going all the way back to January 2007, shortly before King County’s peak pricing.
In March, 44% of homes sold for under $300,000 (the 10th percentile level at the peak). Meanwhile, 72% of homes sold in March went for less than the $481,000 median price at the peak.
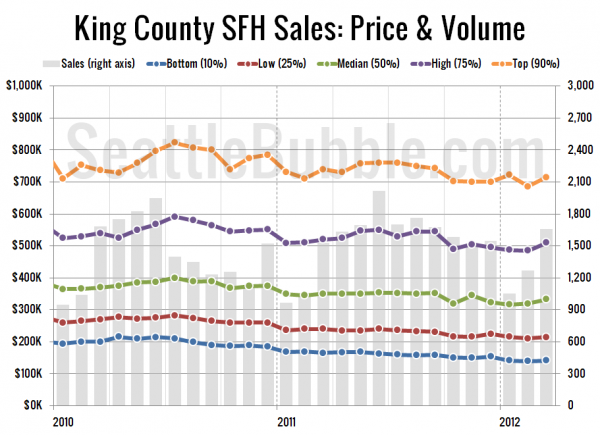
Here’s a closeup look at just 2010, 2011, and 2012 so far:
All five tiers saw a bit of an uptick in March. Here’s where all five percentiles fall compared to their respective peaks as of March:
- Bottom: 53% off peak
- Low: 41% off peak
- Median: 32% off peak
- High: 24% off peak
- Top: 27% off peak
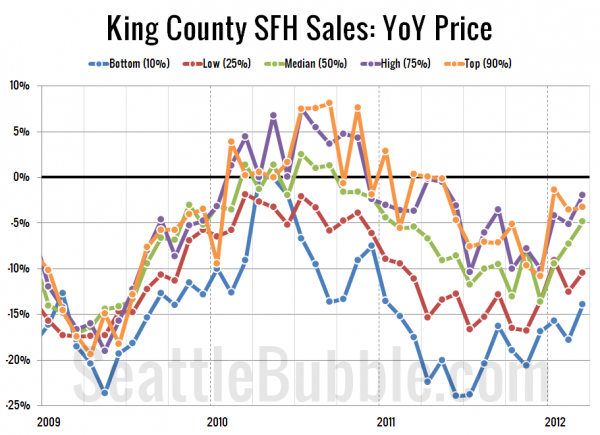
Lastly, here’s a look at the year-over-year price changes in each of the five percentiles.
At this rate, it seems likely that the high and top tiers will break into positive territory in the next three months. Here’s where the tiers stand as of March:
- Bottom: down 14%
- Low: down 10%
- Median: down 5%
- High: down 2%
- Top: down 3%
Quite the turnaround from just three months ago, when all five tiers were in double-digit negative territory.


