Skip to content

Seattle Bubble

local real estate news, statistics, and commentary without the sales spin.

Menu
  • Home
  • About
  • Contact
  • Reference
  • Speaking
Menu

Quick Look at April Supply & Demand

Posted on May 8, 2012 by The Tim

Here are a few charts of the latest NWMLS stats that I included in my presentation last week at Crista that I thought would also be worth sharing here.

In the following charts each bar represents the number of King County single family homes sold or listed in April of each year since 2000.

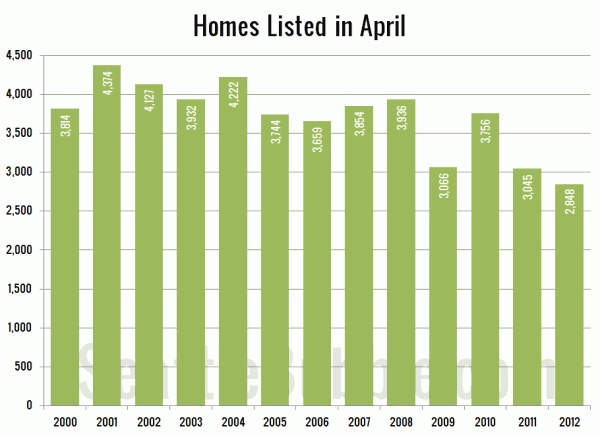
Homes Listed in April: King County SFH

Record low for new listings.

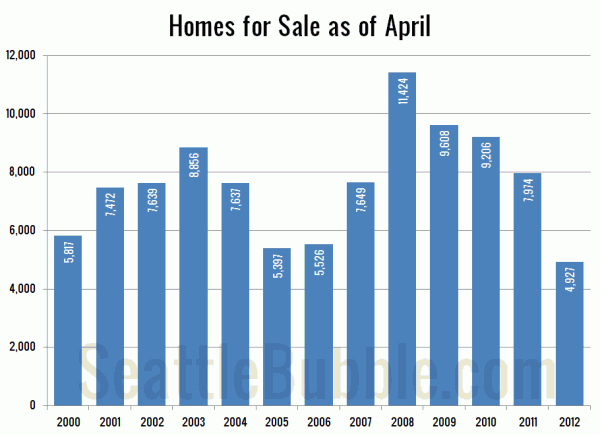
Homes For Sale in April: King County SFH

Record low for total on-market listings.

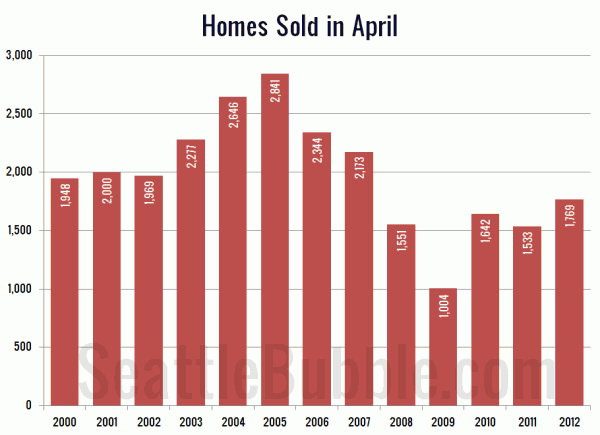
Homes Sold in April: King County SFH

38% below the record high for sales, but 76% above the record low, and just 10% below the pre-boom average between 2000 and 2002.

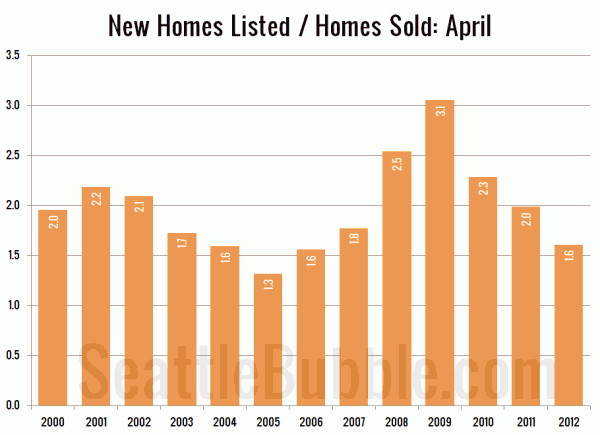
Homes Listed / Homes Sold in April: King County SFH

Tied for the second-lowest year ever in terms of the ratio of new listings to sales.

Prices in most places are better for buyers today than they were a year ago, but personally I would hate to be trying to buy a home right now. The balance of supply and demand is just way too skewed against the buyer.
Share:

  • Twitter
  • LinkedIn
  • Facebook
  • Reddit
  • Pinterest
  • Email

Continue Reading

Next Post:
April Reporting Roundup: Tempered Optimism Edition
Previous Post:
Reader Question: Where are the modest homes?

Tim’s Other Projects

Dispatches from the Multiverse

Tip Jar

Like what we're doing?

Drop us a tip!

Accounts

  • Log in
  • Entries feed
  • Comments feed
  • WordPress.org
©2025 Seattle Bubble | Built using WordPress and Responsive Blogily theme by Superb