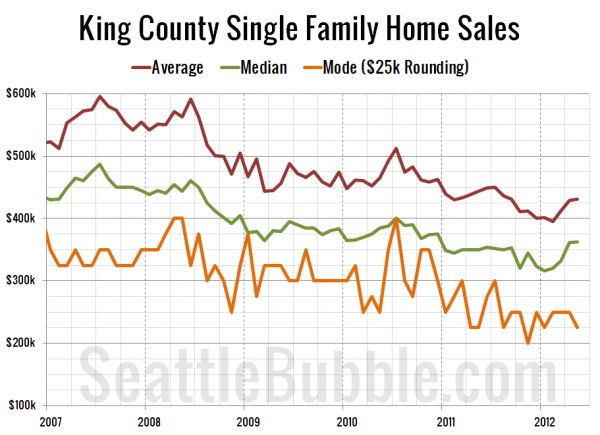
It’s been a few months since we took a look at the average, median, and mode prices all together, so let’s update that chart. Here are the definitions of mode and standard deviation, for those who aren’t stats nerds. Note that for the “mode” in this chart, I have rounded every sale price to the nearest $25,000, and taken the mode of that set.
As of May, the median price is down 25.7% from its July 2007 peak, the average is down 27.6% from its July 2007 peak, and the $25k-rounded mode is down 43.8% from its April-May 2008 peak, hovering between $225,000 and $250,000 for the last ten months, save for a blip down to $200,000 in November.
Despite this spring’s increase in the median and average price, sales are still skewing toward the cheap homes.
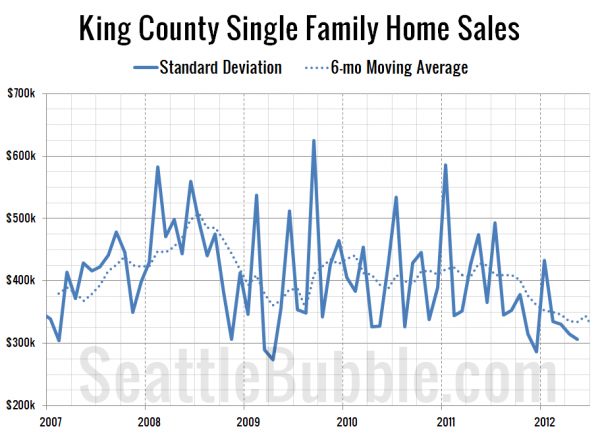
Hit the jump for the plot of the standard deviation, requested by the serious data geeks.
The standard deviation has been decreasing fairly steadily since mid-2011, with the six-month average dropping nearly $100k. This indicates a narrowing of the range of prices that buyers are paying for homes.

