Let’s take an updated look at how King County’s sales are shifting between the different regions around the county, since geographic shifts can and do affect the median price.
In order to explore this concept, we break King County down into three regions, based on the NWMLS-defined “areas”:
- low end: South County (areas 100-130 & 300-360)
- mid range: Seattle / North County (areas 140, 380-390, & 700-800)
- high end: Eastside (areas 500-600)
Here’s where each region’s median prices came in as of March’s data:
- low end: $181,600—$290,750
- mid range: $261,500—$625,000
- high end: $400,000—$1,019,975
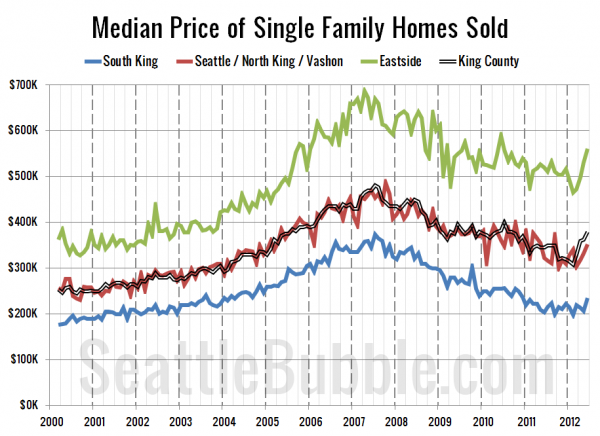
First up, let’s have a look at each region’s (approximate) median price (actually the median of the medians for each area within the region).
All three regions have been on an upswing since February or March, with the high end gaining the most since its early 2012 low point.
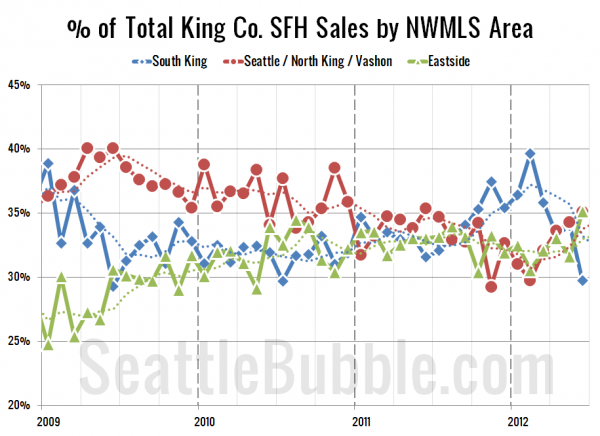
Next up, the percentage of each month’s closed sales that took place in each of the three regions. The dotted line is a four-month rolling average.
That’s a pretty tangled mess, but the key here is that the percentage of each month’s sales that are happening in the cheap parts of the county have been dropping like a rock most of the year, falling from nearly 40% of the sales in February to less than 30% in June. Meanwhile the medium and high price parts of the county are both on the upswing, moving from around 30% in February to 35% in June.
This is another part of why the overall median has been shooting up so much. When fewer sales occur in the cheap parts of the county, the median will go up even if each individual home’s value is unchanged.
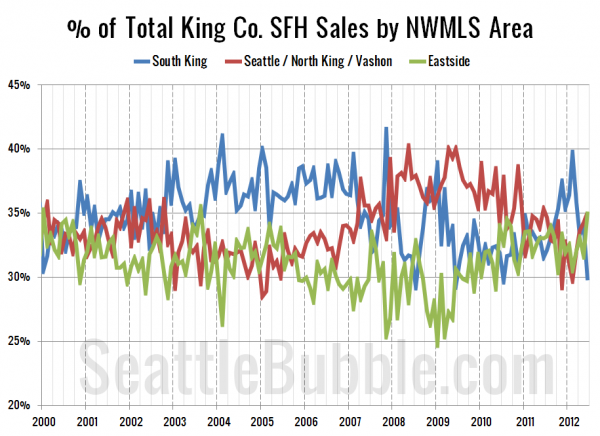
Lastly, here’s an updated look at this same set of data all the way back through 2000:
Three months ago I said:
If this one-month dip in sales in South King continues as we move through the spring and into summer, expect the county-wide median price to continue to climb.
Looks like that’s pretty much exactly what has happened since then. In fact, the percentage of sales that are taking place on the Eastside nearly hit an all-time high in June. It will be interesting to see if this trend continues through the end of 2012.


