Before we put away the Case-Shiller data for another month, let’s check in on a few of our alternative charts.
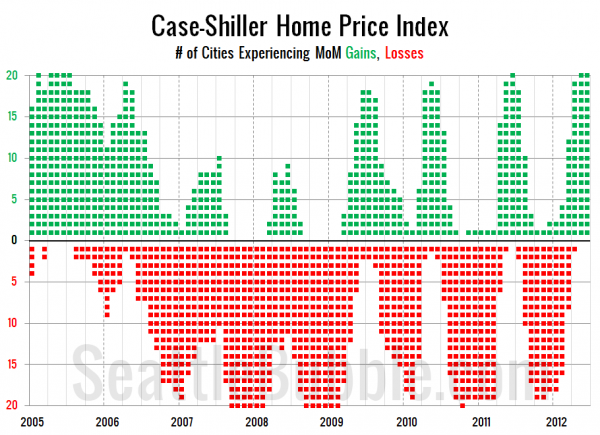
First up, let’s take a look at the twenty-city month-over-month scorecard. Here’s the original post introducing this chart if you’d like more details.
I think it’s worth noting that June marks the first time since July 2005 that all twenty Case-Shiller cities were in the black for two months in a row.
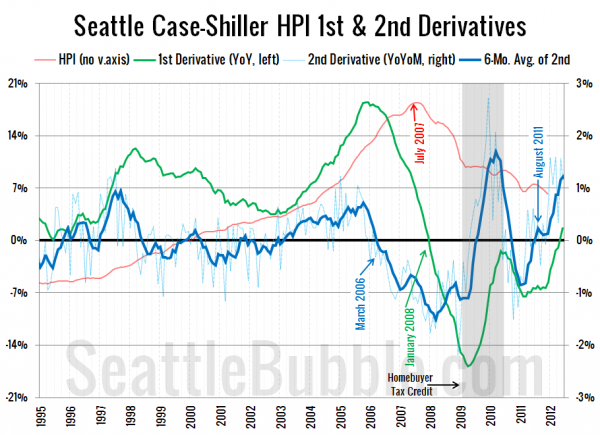
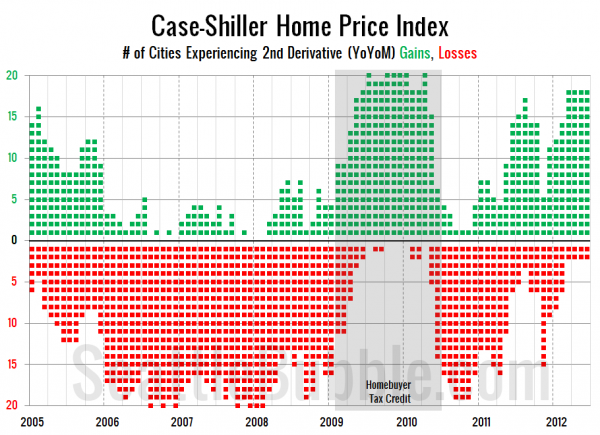
Next up, the second derivative. For an introduction to this particular view, hit the original post from March.
The increasing trend that began in early 2011 is still in effect here in Seattle. As of June 18 cities has positive second derivatives, for the fourth month in a row:
Which two cities fell short has changed each of the last four months. In June it was Charlotte and Dallas. Outside of the period of time when the homebuyer tax credit was screwing with the market this is actually the strongest performance this chart has seen since before 2000.


