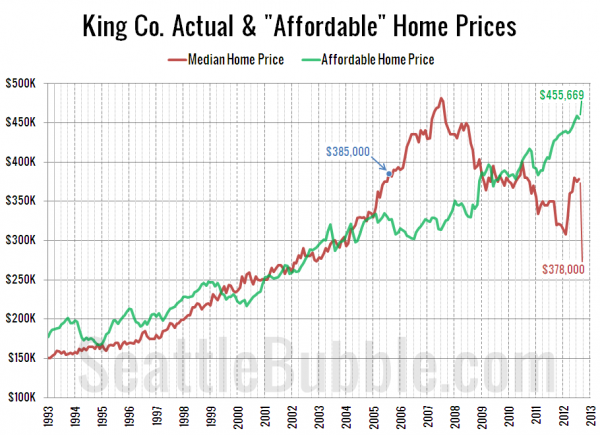
Since we looked at the affordability index yesterday, Let’s have an updated look at the “affordable home” price chart.
In this graph I flip the variables in the affordability index calculation around to other sides of the equation to calculate what price home the median household income could afford to buy at today’s mortgage rates if they put 20% down and spent 30% of their monthly income.
The median price has risen since our last update April, but continued declines in interest rates have offset most of that increase. The median household income can currently “afford” to purchase a home 21% more expensive than the current median price of homes that are selling.
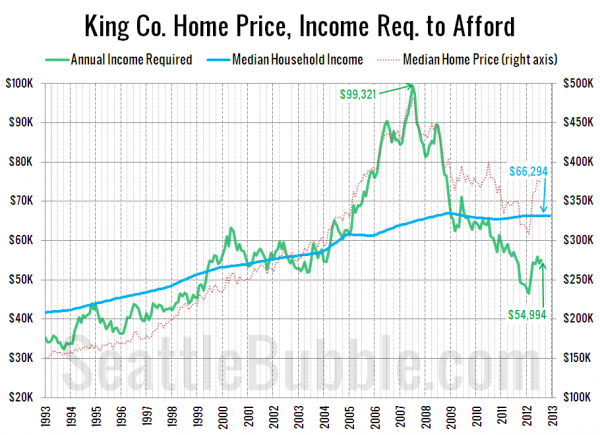
Here’s the last view on this data, where I flip the numbers around one more time to calculate the household income required to make the median-priced home affordable at today’s mortgage rates, and compare that to actual median household incomes.
As of August, a household would need to earn $54,994 a year to be able to afford the median-priced $378,000 home in King County. Meanwhile, the actual median household income is around $66,000.
You can really see the effect of artificially low interest rates in this last chart. Prior to 2009, the median home price and the income needed to afford the median home moved pretty closely together. However, as rates have been pushed through the floor over the last few years, a large gap has opened up between the two lines.
If interest rates were at levels more like they were pre-bust, the necessary income to buy a median-priced home would be slightly higher than the current median household income (which is just another way of saying that the affordability index would be below 100, as detailed in yesterday’s post).

