December market stats were published by the NWMLS this morning. Here’s a snippet from their press release: Northwest MLS Tallies Busy December as First-time Buyers, Investors Return.
Brokers expect the housing market rebound to continue, while cautioning sellers to refrain from becoming too greedy and expressing hope for “controlled natural growth” to sustain the recovery. They also believe distressed properties, rising rents and re-engaged investors will have an impact on activity for the foreseeable future.
“Buyers are taking note of sellers who overprice their homes,” reported Northwest MLS director Darin Stenvers. “These buyers are not wasting their time looking at that section of the market for fear of losing a “turnkey ready” home that they can buy and close on,” added Stenvers, the office managing broker at John L. Scott, Inc. in Bellingham.
You may recall that nearly a third of sellers will overprice on purpose.
All righty, on with our usual monthly stats.
NWMLS monthly reports include an undisclosed and varying number of
sales from previous months in their pending and closed sales statistics.
Here’s your King County SFH summary, with the arrows to show whether the year-over-year direction of each indicator is favorable or unfavorable news for buyers and sellers (green = favorable, red = unfavorable):
| December 2012 | Number | MOM | YOY | Buyers | Sellers |
|---|---|---|---|---|---|
| Active Listings | 2,945 | -20.8% | -46.4% |  |
 |
| Closed Sales | 1,741 | -4.8% | +18.8% |  |
 |
| SAAS (?) | 1.24 | +19.9% | -23.0% |  |
 |
| Pending Sales | 1,617 | -21.2% | +1.6% |  |
 |
| Months of Supply | 1.82 | +0.5% | -47.2% |  |
 |
| Median Price* | $380,046 | -1.3% | +18.8% |  |
 |
Feel free to download the updated Seattle Bubble Spreadsheet (Excel 2003 format), but keep in mind the caution above.
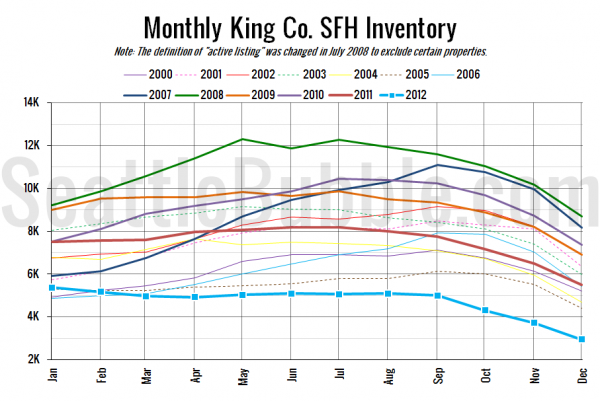
A few stats of note: before November of last year, King County single-family inventory had never (since my data starts in 2000) dropped below 4,000, let alone below 3,000. Inventory is insanely anemic. Also of interest, pending sales dropped to their lowest year-over-year increase since the post-tax-credit sales hangover.
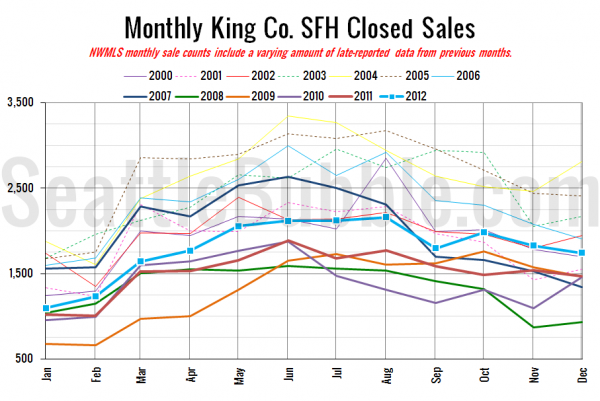
Here’s your closed sales yearly comparison chart:
Pretty typical for this time of year.
Here’s the graph of inventory with each year overlaid on the same chart.
Another record low for inventory, dropping below 4,000 single-family homes for the first time on record.
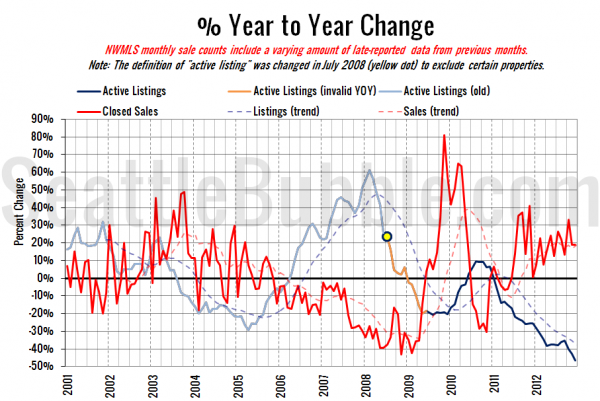
Here’s the supply/demand YOY graph. In place of the now-unreliable measure of pending sales, the “demand” in this chart is represented by closed sales, which have had a consistent definition throughout the decade.
Well, we definitely ended the year on a low note for buyers.
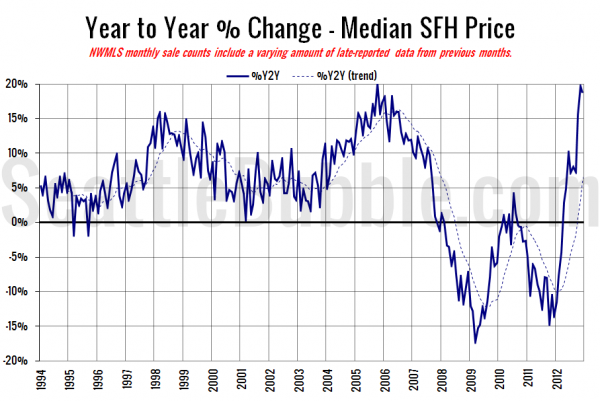
Here’s the median home price YOY change graph:
Down just a bit from last month, but we’re still comparing to a time a year ago when bank-owned sales were through the roof. I expect this to drop dramatically over the next few months.
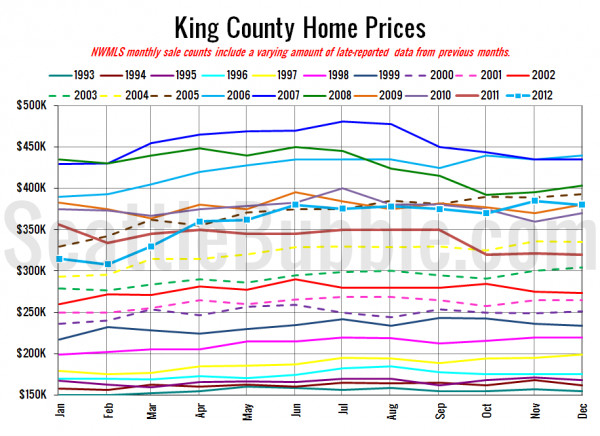
And lastly, here is the chart comparing King County SFH prices each month for every year back to 1994.
December 2012: $380,046
September 2005: $381,250
Here are the headlines from the Times and P-I:
Seattle Times: Local inventory of homes for sale hits another record low
Seattle P-I: December saw slowing home sales, rising prices
Check back tomorrow for the full reporting roundup.
