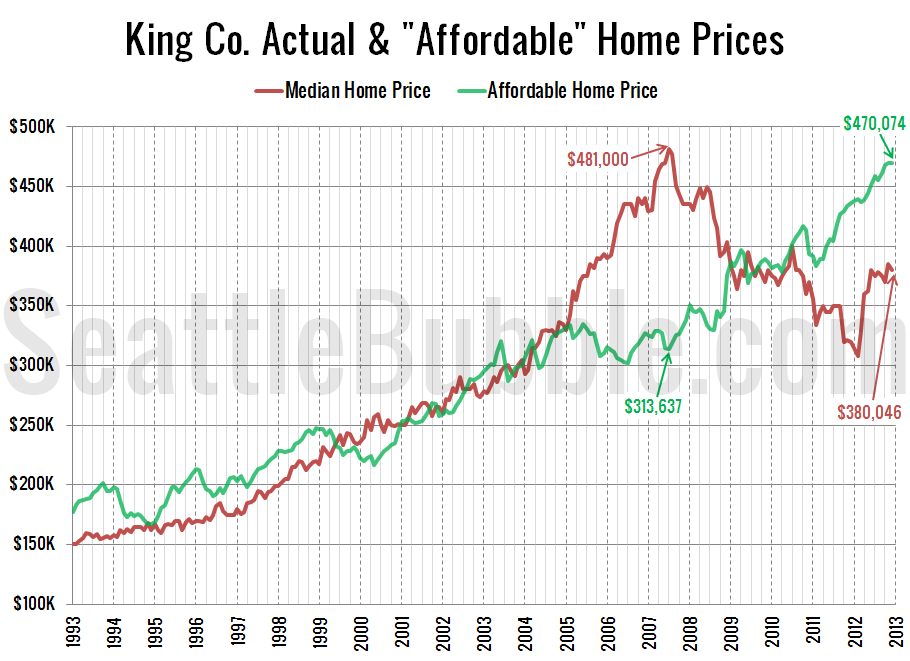
Since we looked at the affordability index last week, Let’s have an updated look at the “affordable home” price chart.
In this graph I flip the variables in the affordability index calculation around to other sides of the equation to calculate what price home the median household income could afford to buy at today’s mortgage rates if they put 20% down and spent 30% of their monthly income.
Median prices have been basically flat since our last update in August, but thanks to yet another dip in interest rates from 3.60% to 3.35%, the price of an “affordable” home in King County rose from $455,669 in August to $470,074 in December. We’re rapidly approaching the point where the “affordable” home price will be on par with what the median home price was at the peak. Ridiculous.
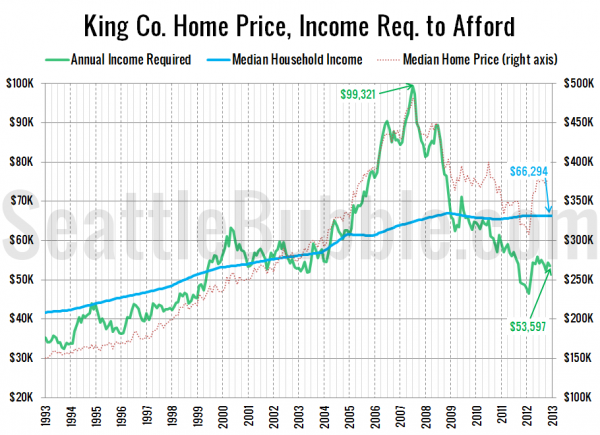
Here’s the alternate view on this data, where I flip the numbers around to calculate the household income required to make the median-priced home affordable at today’s mortgage rates, and compare that to actual median household incomes.
As of December, a household would need to earn $53,597 a year to be able to afford the median-priced $380,046 home in King County (down from $54,994 in August). Meanwhile, the actual median household income is around $66,000.
If interest rates were at levels at 6% (comparable to where they were pre-bust), the necessary income to buy a median-priced home would be $72,914, and the “affordable” home price would be $345,539—$35k below the current median.


