Let’s take an updated look at how King County’s sales are shifting between the different regions around the county, since geographic shifts can and do affect the median price.
In order to explore this concept, we break King County down into three regions, based on the NWMLS-defined “areas”:
- low end: South County (areas 100-130 & 300-360)
- mid range: Seattle / North County (areas 140, 380-390, & 700-800)
- high end: Eastside (areas 500-600)
Here’s where each region’s median prices came in as of December data:
- low end: $194,950—$335,500
- mid range: $272,000—$656,500
- high end: $384,498—$1,095,000
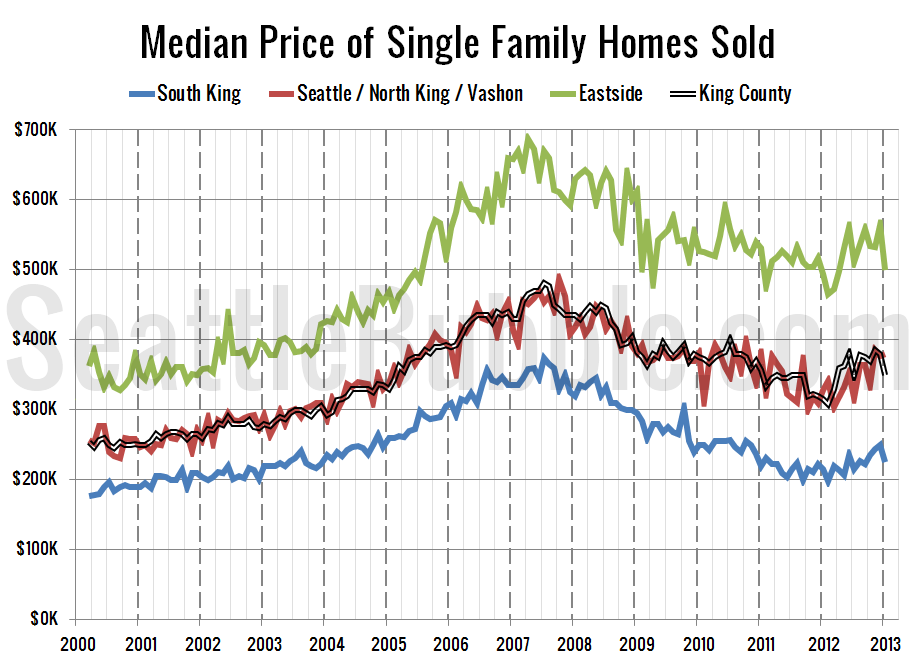
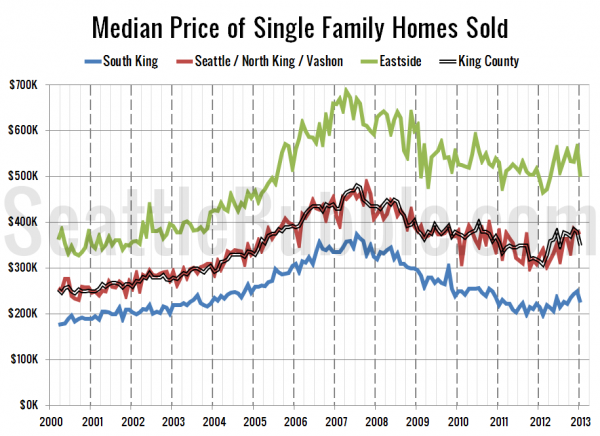
First up, let’s have a look at each region’s (approximate) median price (actually the median of the medians for each area within the region).
In a flip from December, the middle tier regions inched up slightly in January, while the low and high regions both fell.
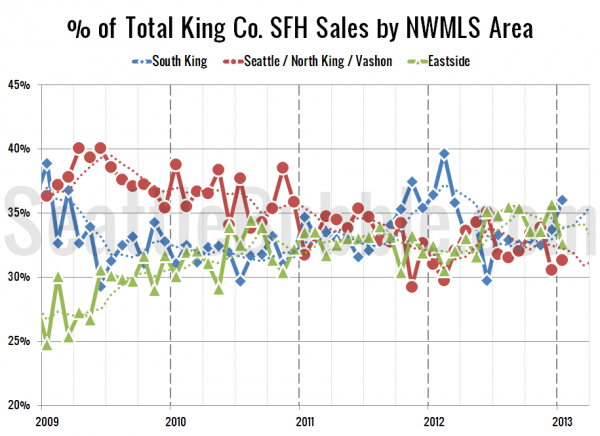
Next up, the percentage of each month’s closed sales that took place in each of the three regions. The dotted line is a four-month rolling average.
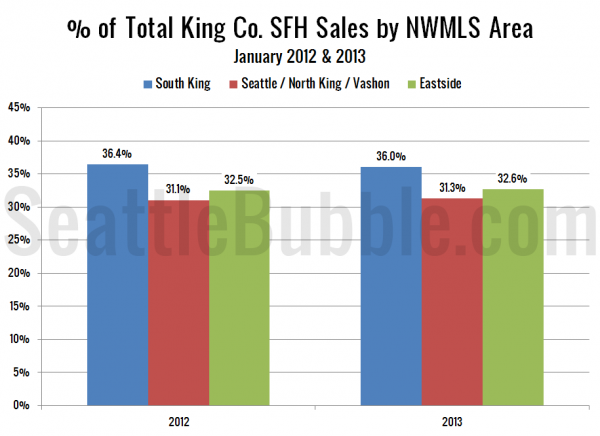
The high tier fell while the low tier surged in January, which fits nicely with the big drop in the overall median price. As of January 2013, 36.0% of sales were in the low end regions, 31.3% in the mid range, and 32.6% in the high end. A year ago the numbers were almost identical: the low end made up 36.4% of the sales, the mid range was 31.1%, and the high end was 32.5%.
Here’s that information in a visual format:
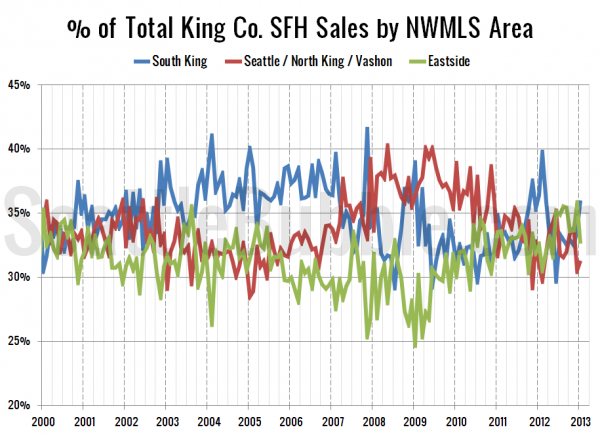
Finally, here’s an updated look at the percentage of sales data all the way back through 2000:
Last month’s shift put us back to a more normal market where the low end regions make up more of the sales. It will be interesting to see if this persists as we get further into the year.
