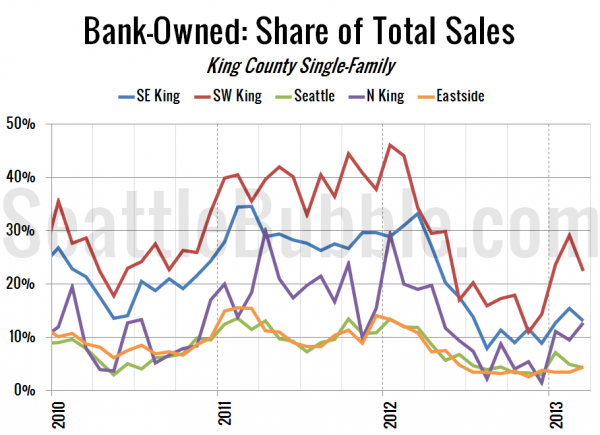
I haven’t posted this in a few months, but here’s a chart that I keep of the share of sales in each NWMLS region that were bank-owned.
In this chart I’ve grouped zip codes into their approximate NWMLS regions, which break South County into SE King and SW King and display Seattle and N King separately.
Southwest King County is still the leader, where nearly a quarter (22.5%) of sales are still bank-owned homes. Unsurprisingly, Seattle and the Eastside are still the lowest, where bank-owned homes made up just 4.3% and 4.4% of sales in March.
Interestingly, sales of bank-owned homes in North King County (Shoreline, Lake Forest Park, Kenmore) have shot up from just 1.4% in December (lower than Seattle and the Eastside) to 12.7% in March. From what I have seen of the inventory situation in those areas, this is probably just because very few non-distressed listings have been hitting the market in the last few months.

