In the comments on yesterday’s jobs post, Blurtman leveled the following criticism:
Shame on you, Tim, for publishing misleading data. You cannot say that unemployment has dropped nationwide without also commenting on the record high not in the labor force number. I trust you are not turning into a NAR cheerleader at this stage. Remember, if there were zero jobs, and folks stopped looking, the unemployment rate would be zero, and yet no one would be working. Tsk, tsk…
The jobs posts, like most of the content on this site, are intended to be primarily about what’s going on in the local area, and as the first chart showed, the number of jobs in the Seattle area has been growing since late 2010. That’s hardly a “zero jobs” scenario.
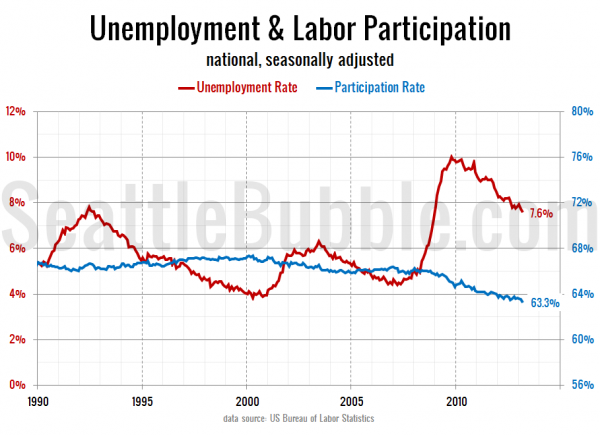
That said, I love a good data request, so here’s a chart of national labor force participation alongside the unemployment rate:
Indeed, in 2006-2007 when unemployment was at its lowest (~4.5%) before the housing bubble popped, the national labor force participation rate was at 66.3%. As of March it is three points lower at 63.3%, while unemployment stands at 7.6%.
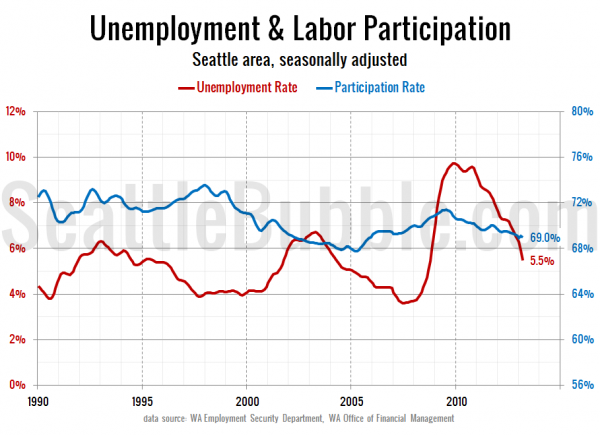
Here in the Seattle area the picture is somewhat different, though:
In early 2007 when Seattle’s unemployment was as low as 3.6%, the local labor force participation rate was at 69.5%. As of March, unemployment is at 5.5%—nearly two points higher than it was pre-bust—but the labor force participation rate is virtually the same, at 69.0%.
Even when you include the labor force participation rate in the local picture, the jobs situation is clearly improving. That’s not to say that the jobs that are being added pay well compared to those that were lost during the bust, but there’s no denying that the Seattle area is adding jobs and unemployment is falling fast.
- Seattle Employment: Washington State Employment Security Department
- Seattle Population: Washington State Office of Financial Management
- National Data: Bureau of Labor Statistics


