This poll was active 04.21.2013 through 04.27.2013
Month: April 2013
Weekly Twitter Digest (Link Roundup) for 2013-04-19
"Financiers worry Seattle’s apartment boom is overdone" http://t.co/463RRbQgsN via @SeattleTimes -> "Over the long haul, the economy grows when people invest in things other than housing." http://t.co/KgOnC2unkx via @WSJ -> "'Apodment' living isn't for Snohomish, council says" http://t.co/EwMmy29UiF via @EverettHerald ->
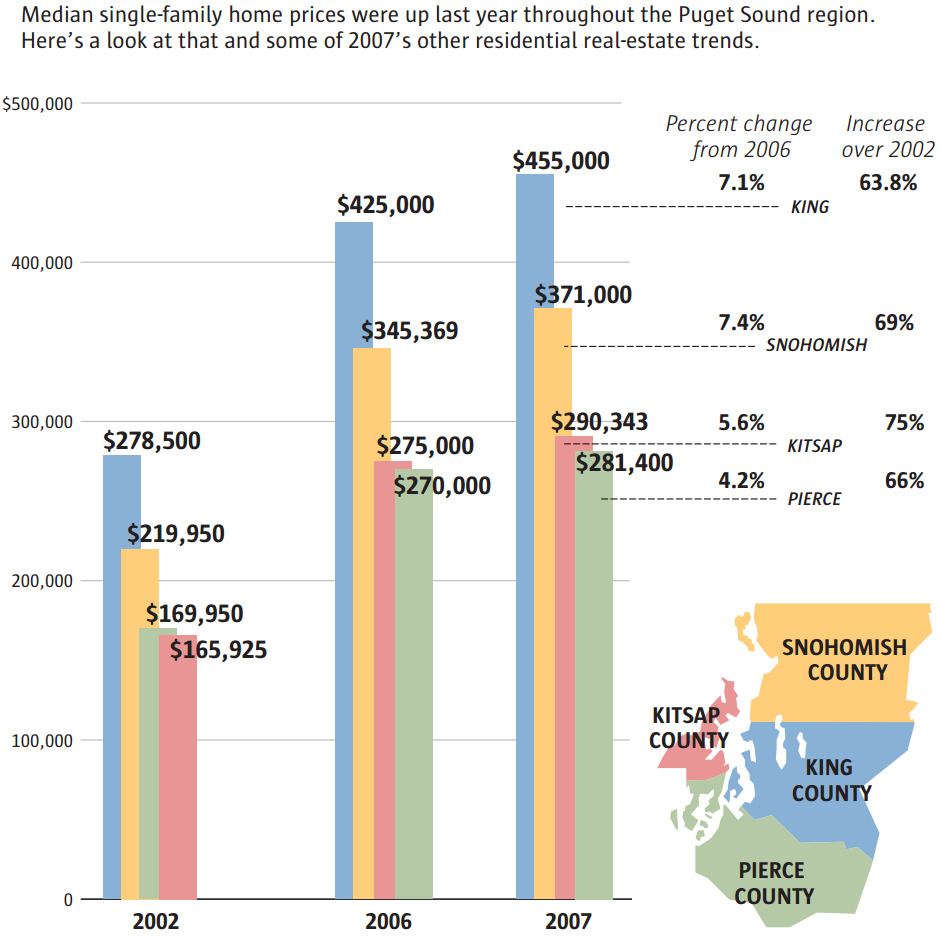
Friday Flashback: “Prices more than held their own.”
Six months after home prices in the Seattle area began declining from their July 2007 peak, the annual report from the NWMLS led to a series of amusingly rosy stories in the local press in early 2008. Here’s a typical example from the Seattle Times: ’07 home prices not so bad after all With all…
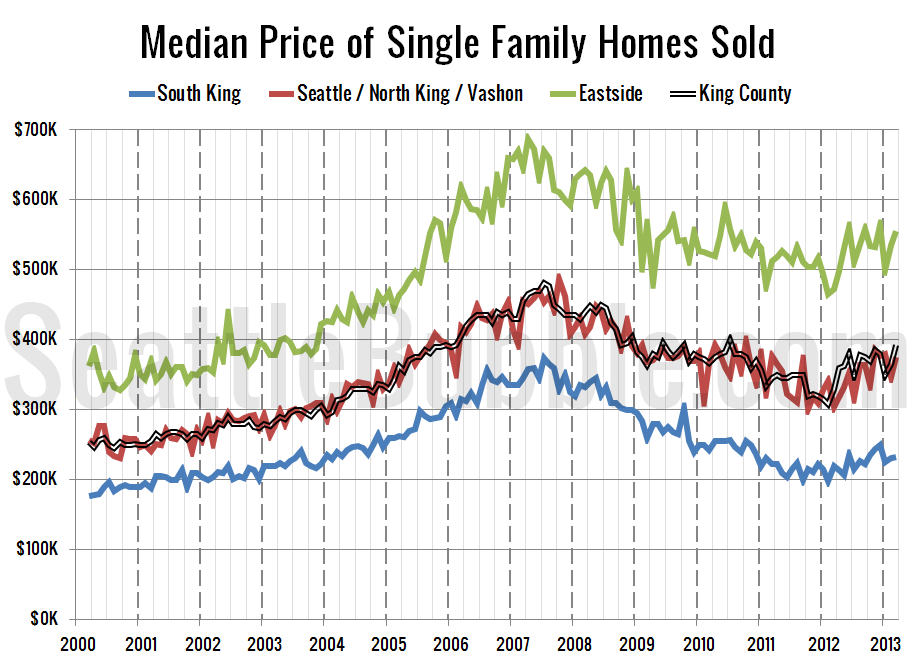
South King and Eastside Sales Neck and Neck
Let’s take an updated look at how King County’s sales are shifting between the different regions around the county, since geographic shifts can and do affect the median price. In order to explore this concept, we break King County down into three regions, based on the NWMLS-defined “areas”: low end: South County (areas 100-130 &…

Southwest King County Still Most-Distressed
I haven’t posted this in a few months, but here’s a chart that I keep of the share of sales in each NWMLS region that were bank-owned. In this chart I’ve grouped zip codes into their approximate NWMLS regions, which break South County into SE King and SW King and display Seattle and N King…