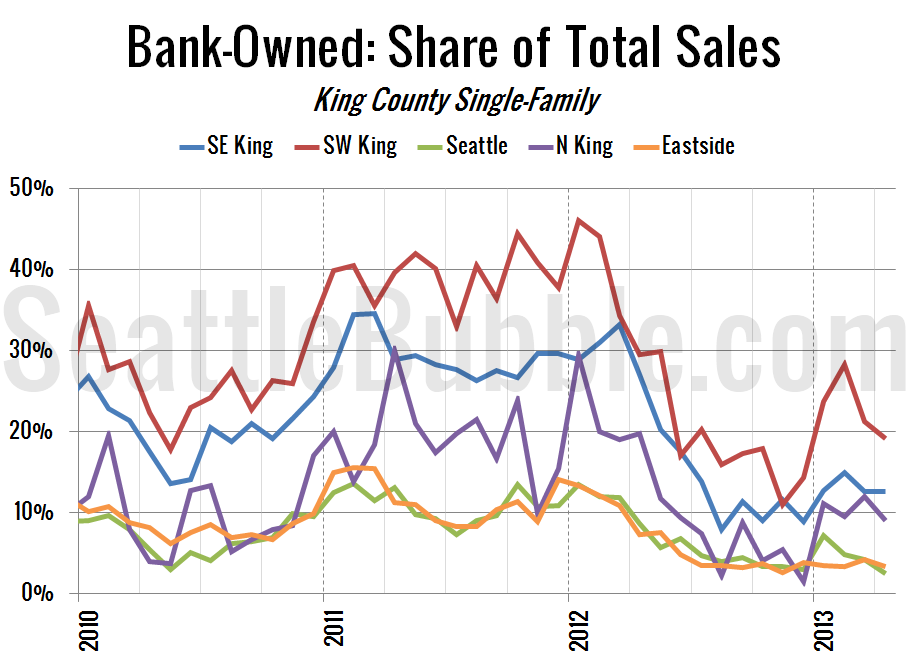
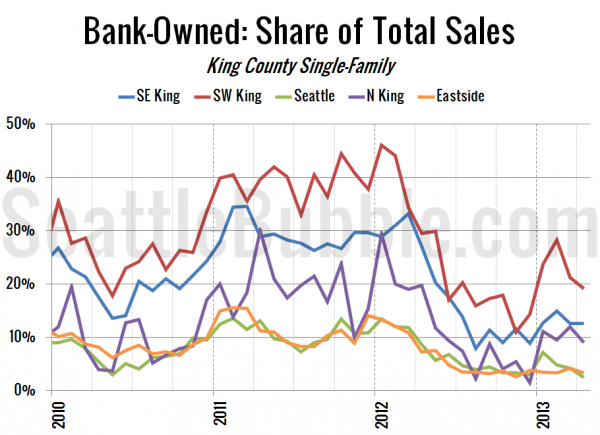
Here’s one more chart on the share of sales that were bank-owned homes. This one shows the share of sales that were bank-owned broken down by the NWMLS-defined regions.
In this chart I’ve grouped zip codes into their approximate NWMLS regions, which break South County into SE King and SW King and display Seattle and N King separately.
Southwest King County is still much more distressed than the other regions, but steep declines in the last two months have dropped its share of bank-owned sales from 28% in February to just 19% in April. Seattle and the Eastside have decreased as well, and now sit at just 2.4% and 3.3% respectively.
After shooting up from 1.4% in December to 11.9% in March, bank-owned sales fell to 9.0% of the total in North King County in April.
Overall, the effects of distressed inventory and sales are mostly behind us in the Seattle area, save for Southwest King County, which still seems to have a bit to work through this year.

