June market stats were published by the NWMLS this afternoon. Here’s a snippet from their press release: Northwest MLS brokers say market stays "extremely competitive;" some industry experts believe "housing affordability may never be better".
Current market conditions — including rising mortgage rates, tight inventory and declining unemployment — are driving even more buyers into what is already an “extremely competitive housing market,” reported OB Jacobi, a member of the board of directors for Northwest Multiple Listing Service.
…
“We desperately need more properties to sell to satisfy the current demand,” said Mike Gain, president and CEO of Prudential Northwest Realty Associates. Despite shortages, Gain said “on-the-fence” buyers are jumping into the market now to lock into today’s low interest rates at today’s prices before they rise further,” which is expected. “Today’s buyers may never see a better time to purchase a home,” he added.
Housing affordability will NEVER be better! Get in now before you’re priced out FOREVER! Gee, that sentiment sounds familiar…
I photographed that sign at a local brokerage office in August 2006.
Conveniently absent from today’s release are the facts that:
- Inventory has been steadily increasing for the last three months in a row.
- Both pending sales and closed declined between May and June.
- The speed of the market slowed in May and likely again in June.
- Multiple offers actually decreased in May and again in June.
Things are hot, but they’re definitely cooling over the last few months. So obviously, it’s time to crank the hype machine up to eleven!
All righty, on with our usual monthly stats.
NWMLS monthly reports include an undisclosed and varying number of
sales from previous months in their pending and closed sales statistics.
Here’s your King County SFH summary, with the arrows to show whether the year-over-year direction of each indicator is favorable or unfavorable news for buyers and sellers (green = favorable, red = unfavorable):
| June 2013 | Number | MOM | YOY | Buyers | Sellers |
|---|---|---|---|---|---|
| Active Listings | 4,203 | +11.8% | -17.4% |  |
 |
| Closed Sales | 2,422 | -3.7% | +14.4% |  |
 |
| SAAS (?) | 1.42 | +8.7% | -1.7% |  |
 |
| Pending Sales | 3,092 | -4.4% | +11.4% |  |
 |
| Months of Supply | 1.36 | +17.0% | -25.9% |  |
 |
| Median Price* | $427,500 | +2.4% | +12.5% |  |
 |
Feel free to download the updated Seattle Bubble Spreadsheet (Excel 2003 format), but keep in mind the caution above.
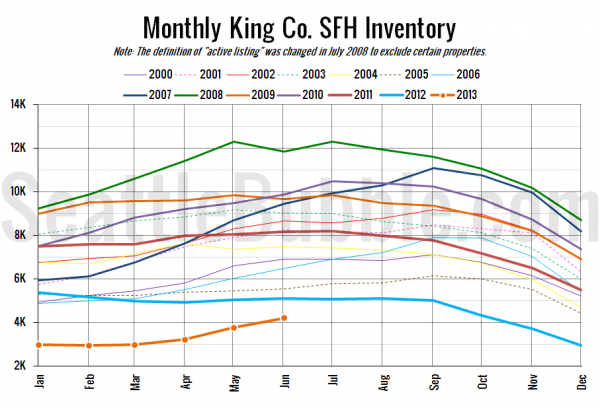
As predicted Monday in our stats preview, inventory increased again between May and June.
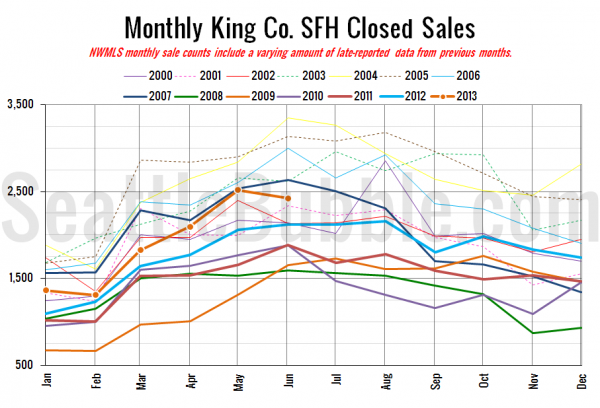
Here’s your closed sales yearly comparison chart:
Most years see an increase in sales between May and June. This year’s four percent drop definitely points to a softening market.
Here’s the graph of inventory with each year overlaid on the same chart.
Still the lowest June on record, but heading for better days soon.
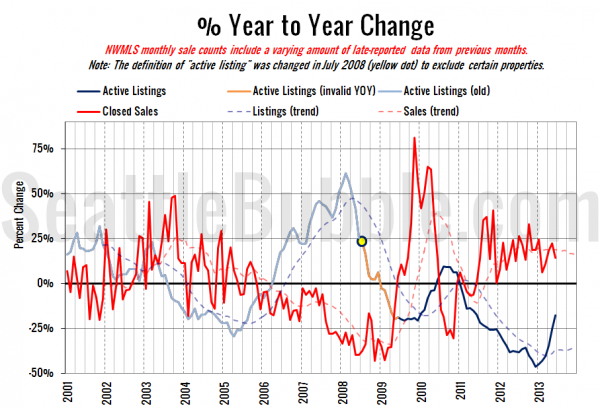
Here’s the supply/demand YOY graph. In place of the now-unreliable measure of pending sales, the “demand” in this chart is represented by closed sales, which have had a consistent definition throughout the decade.
Both measures heading back toward zero… A balanced market is on the horizon.
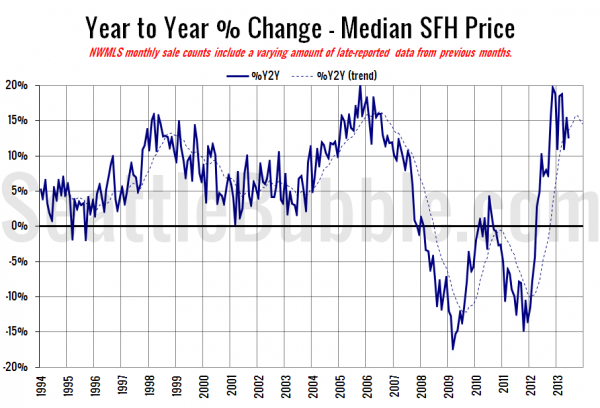
Here’s the median home price YOY change graph:
Another bump up as the median home price gained $10,000 in a single month.
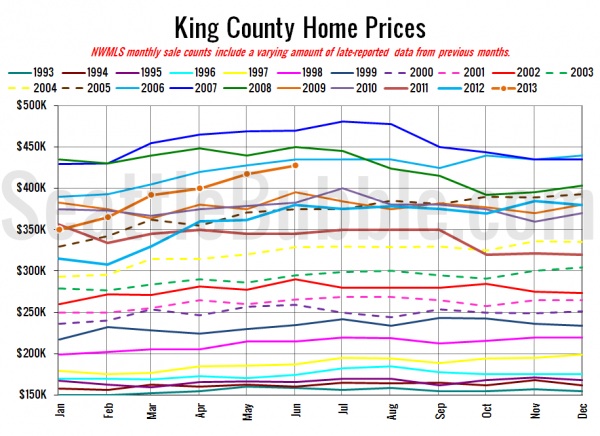
And lastly, here is the chart comparing King County SFH prices each month for every year back to 1994.
June 2013: $427,500
May 2006: $429,950
I haven’t seen any articles about the numbers yet at the Times and P-I, but I’ll update this post when they’re posted.
Update: Here they are:
Seattle Times: King County median home price up 12.5 percent from June 2012
Seattle P-I: Buyers fighting for homes as mortgage rates rise

