Before we put away the May Case-Shiller data, let’s have a look at my favorite alternative Case-Shiller charts.
First up, let’s take a look at the twenty-city month-over-month scorecard. Here’s the original post introducing this chart if you’d like more details. Click the image below for a super-wide version with the data back through 2000.

April and May both saw all twenty cities experiencing month-over-month gains, a feat that has not been accomplished since 2005.
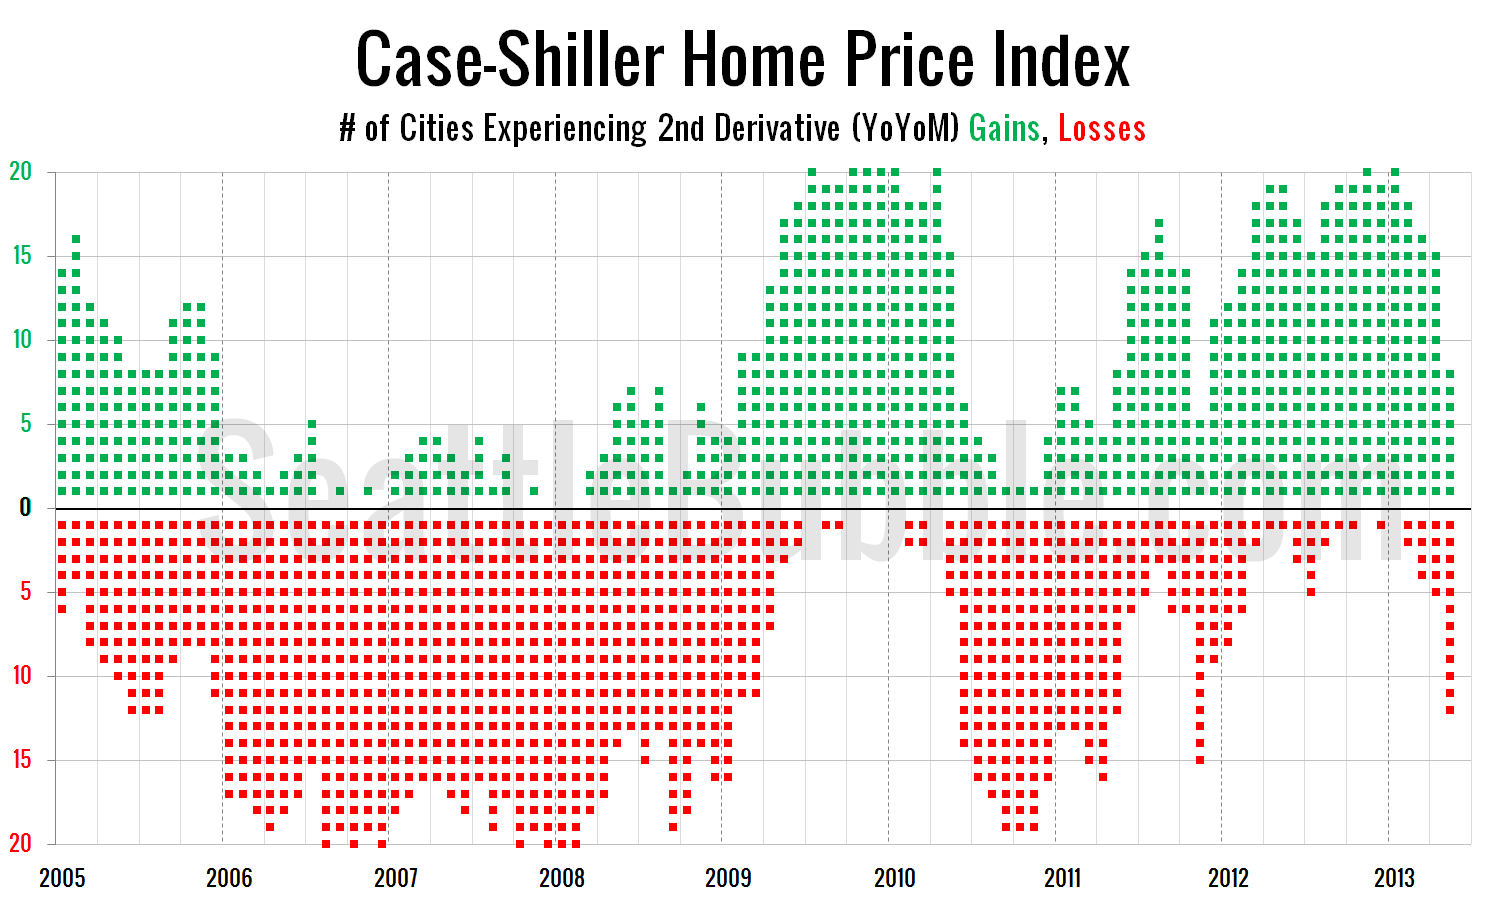
But everything is not necessarily coming up roses… here’s a look at the number of cities that are experiencing second derivative Case-Shiller gains or losses.
 Gains, Losses - Click to enlarge")
The number of cities experiencing second derivative gains dropped like a rock in May. I consider the second derivative to be a leading indicator of price trends, so a sudden drop in this measure is something to keep an eye on for sure. If this trend keeps up I expect we’ll see prices flat-line by the end of the year.