It’s time once again to take an updated look at how King County’s sales are shifting between the different regions around the county, since geographic shifts can and do affect the median price.
In order to explore this concept, we break King County down into three regions, based on the NWMLS-defined “areas”:
- low end: South County (areas 100-130 & 300-360)
- mid range: Seattle / North County (areas 140, 380-390, & 700-800)
- high end: Eastside (areas 500-600)
Here’s where each region’s median prices came in as of May data:
- low end: $238,500-$370,000
- mid range: $353,000-$650,000
- high end: $481,500-$1,540,000
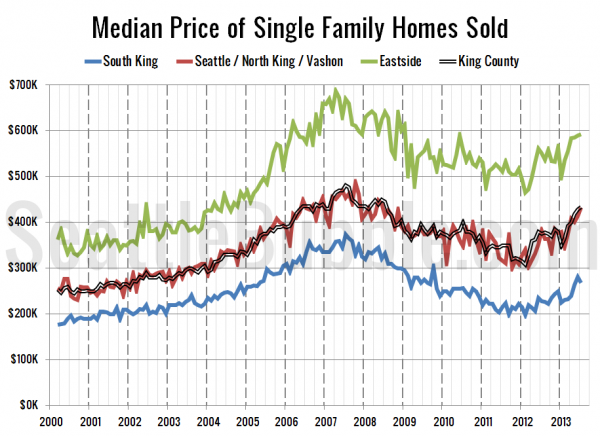
First up, let’s have a look at each region’s (approximate) median price (actually the median of the medians for each area within the region).
The low end region actually slipped a bit between June and July, losing 4.8% month-over-month. However, the low end was still up 17.4% year-over-year. The middle tier was up 4.4% MOM and 12.9% YOY, while the high tier gained 0.3% MOM and 7.4% YOY.
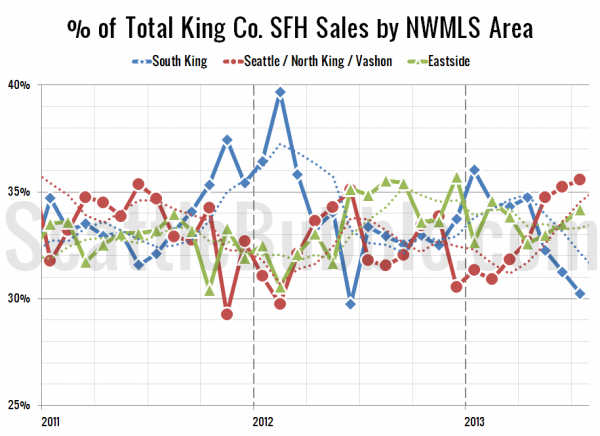
Next up, the percentage of each month’s closed sales that took place in each of the three regions. The dotted line is a four-month rolling average.
The share of sales that are taking place in the cheapest parts of the county continues to drop, down from 34.7% in April to 30.2% in July. Over the same four-month period, the share of sales in the high end regions has risen from 32.6% to 34.2%. This explains how the median price can be falling in 14 of the 29 neighborhoods but rising county-wide.
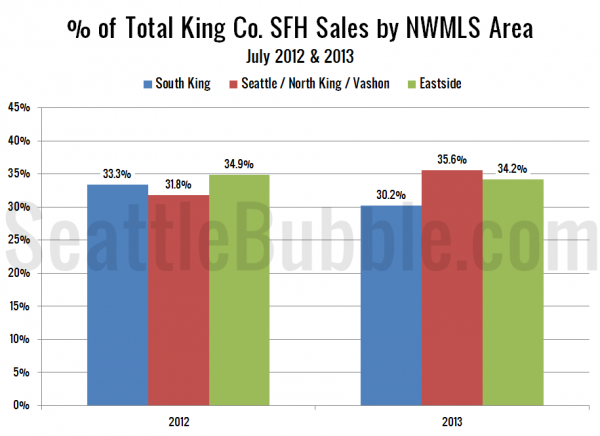
As of July 2013, 30.2% of sales were in the low end regions, 35.6% in the mid range, and 34.2% in the high end. A year ago the low end regions had more of the share and the mid range more: In July 2012 the low end made up 33.3% of the sales, the mid range was 31.8%, and the high end was 34.9%.
Here’s that information in a visual format:
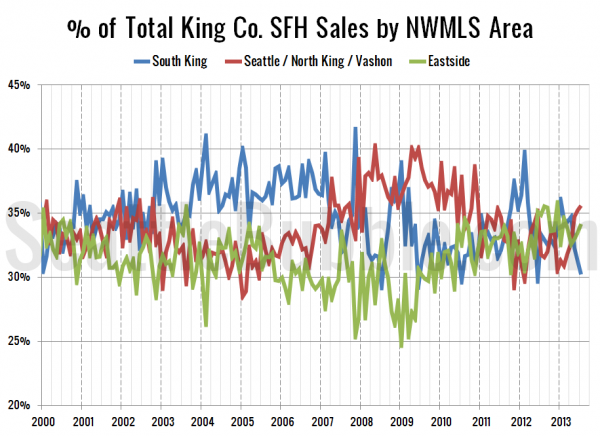
Finally, here’s an updated look at the percentage of sales data all the way back through 2000:
July marks three months in a row that the middle tier has had the most sales while the low tier has the least, which is quite unusual historically.


